Geovisualization of Mobility Patterns using Multisource Data: A Case Study at Envelopa Campus, Olomouc, Czechia

Diploma thesis submitted in fulfillment of the requirements for the degree of Copernicus Master in Digital Earth , 2026

This diploma thesis analyses mobility patterns within the Envelopa Campus of Palacký University Olomouc from May 2025 to May 2026 using multiple data sources. The study combines Telraam traffic counts, EnCLOD municipal sensor data, anonymised Nextbike journey records and CHMI weather observations to examine how movement varies across space, time, transport modes and academic periods.

The main output is an interactive web map dashboard that presents the processed datasets, key analytical findings and mobility visualizations in an accessible form. The work also evaluates the quality, uncertainty and limitations of the employed datasets, showing how heterogeneous mobility data can be used meaningfully without treating all sources as directly interchangeable.

Objectives

The thesis investigates how heterogeneous mobility data sources can be used to effectively assess movement patterns within the Envelopa Campus during the study period. The work focuses on turning independent mobility datasets into comparable, interpretable and visually communicable outputs.

  • Objective 1: Review methods for combining and visualizing multisource mobility data with different spatial and temporal resolutions.
  • Objective 2: Collect, clean and harmonise mobility datasets from Telraam, EnCLOD, Nextbike and CHMI.
  • Objective 3: Analyse spatial and temporal mobility patterns, including academic-period effects, weather sensitivity and dataset limitations.
  • Objective 4: Develop an interactive web map dashboard for communicating mobility trends, comparisons and key findings.

Overall, the thesis aims not only to describe mobility within the AOI, but also to show how different mobility datasets can be compared and communicated responsibly.

Methodology

The methodology combined data acquisition, quality assessment, preprocessing, temporal aggregation, spatial analysis, statistical comparison and interactive geovisualization. The workflow was designed to make mobility patterns comparable across datasets while preserving the meaning and limitations of each source. Python was used for data processing and statistical analysis, while the interactive dashboard was developed using HTML, CSS, JavaScript and Leaflet.

Study area

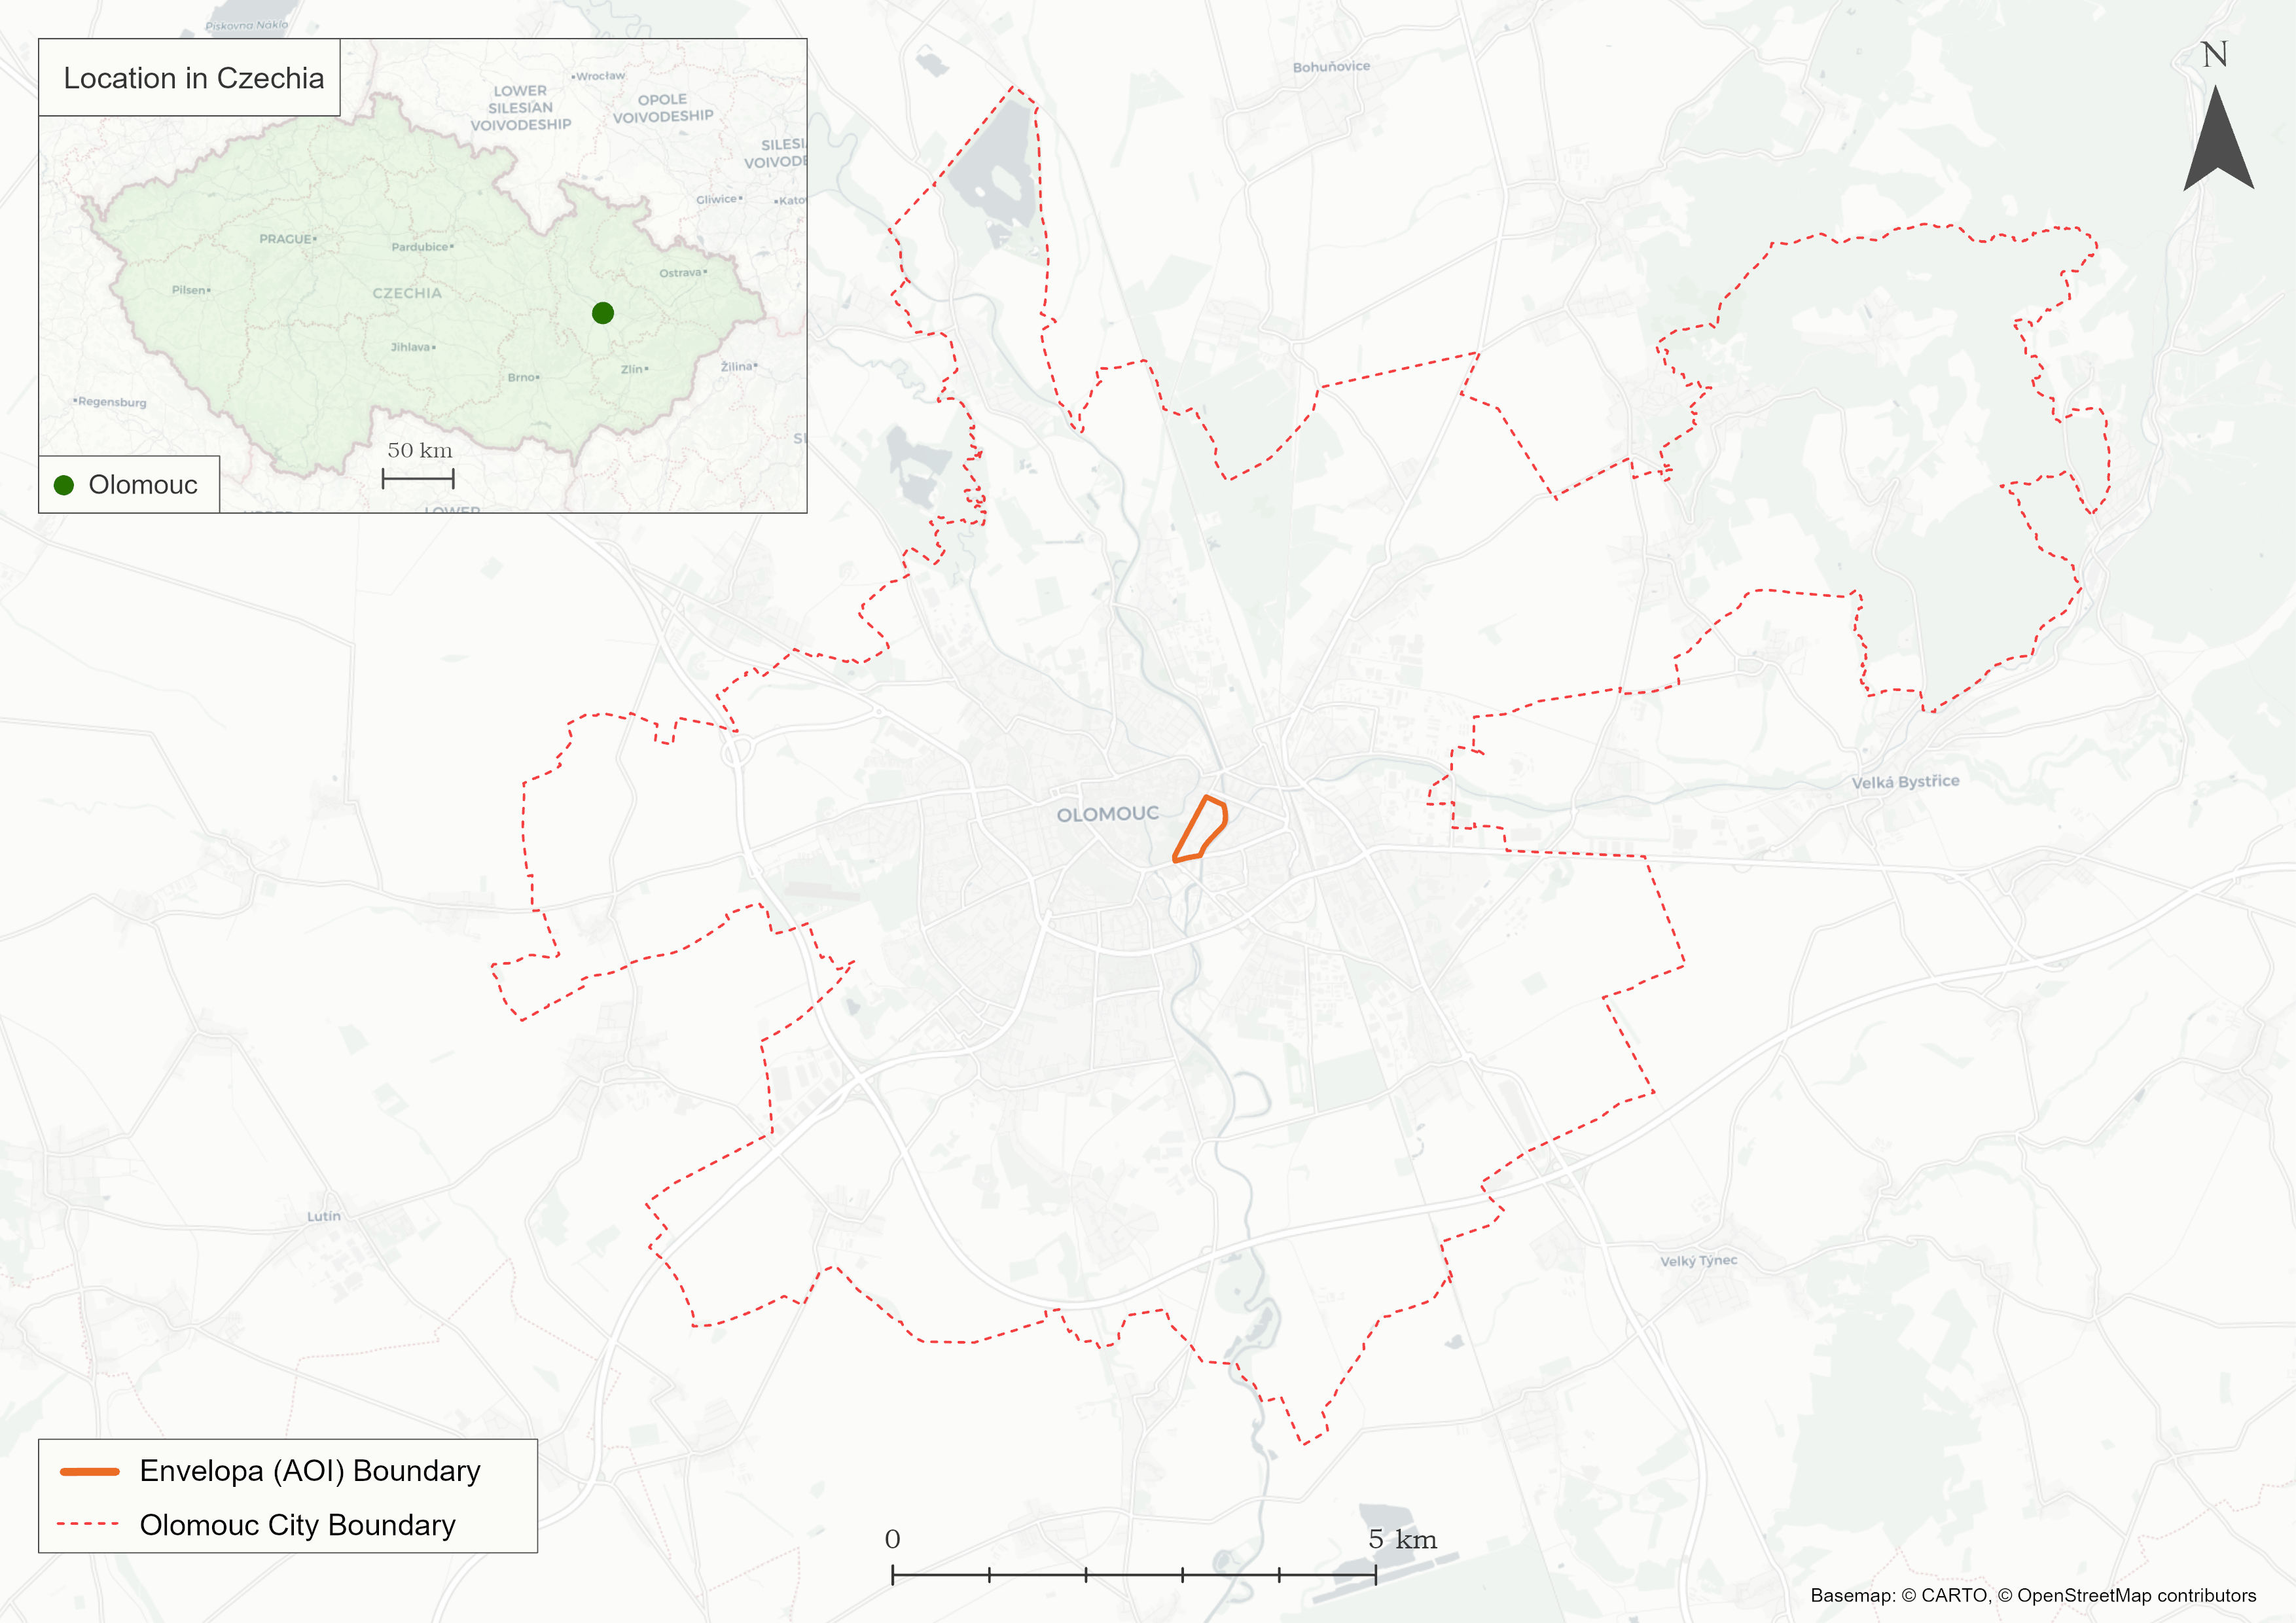
The AOI, presented in Figure 1, is located in the south-eastern part of Olomouc and is bounded by 17. Listopadu, Třída Kosmonautů, Masarykova Třída and the Morava River. It covers approximately 0.17 km² and contains university buildings, dormitories, teaching and study facilities, public spaces, roads, cycleways and pedestrian routes. The Envelopa Campus was selected because it concentrates university-related mobility and wider urban movement within a compact urban space. It is used by students, university staff, residents, visitors and commuters, while also connecting the campus to surrounding neighbourhoods and the wider city centre.

Map showing the location of the Envelopa Campus study area in Olomouc
Figure 1. Location of the Envelopa Campus study area in Olomouc, Czechia

Data sources

EnCLOD and CHMI data were acquired through APIs, Telraam data were downloaded from the online user interface, and Nextbike data was provided directly by the company. The datasets differ in structure and meaning: EnCLOD represents motor-vehicle observations along road segments, Telraam records multimodal traffic at two camera-based sensor locations, Nextbike provides bike-share journey origin-destination pairs, and CHMI provides meteorological context. Table 1 summarises the role and main limitation of each dataset.

Table 1. Overview of mobility and contextual datasets used in the thesis
Dataset Role in the thesis Main limitation
Telraam Multimodal traffic counts for pedestrians, bicycles, cars, large vehicles and night totals. Nighttime detections are not separated by transport mode.
EnCLOD Municipal motor-vehicle counts from traffic-classifier magnetometers in the AOI. Some sensors contain many incomplete hourly observations.
Nextbike Anonymised bike-share origin-destination records used to infer likely cycling movement. Only start and end points are available, not observed routes.
CHMI Weather observations used to assess associations between mobility and meteorological conditions. The station is approximately 2 km from the AOI.

Processing and analysis workflow

After acquisition, each dataset followed a source-specific cleaning and harmonisation workflow before temporal aggregation, spatial analysis, statistical comparison and dashboard integration.

Preprocessing

Processing workflows were developed for each dataset. Input data were cleaned, standardised and checked for completeness before being transformed into consistent analytical outputs. Nextbike records were filtered to retain trips with a start and/or end point within the AOI, and trips with start and end coordinates within 30 m of each other were removed because no meaningful journey could be inferred.

Temporal aggregation

Data were aggregated by day, week, month, weekday within month and academic term. Academic periods were used because a substantial proportion of movement within the AOI was likely connected to the university calendar. The use of several aggregation levels allowed both short-term variation and broader semester-related trends to be explored.

Route modelling

Because Nextbike records contain origin and destination coordinates but no observed routes, likely cycling paths were estimated using a least generalised cost-path approach. A bikeability index was produced for Olomouc using NetAScore and used to weight the cycling network. The resulting routes should be interpreted as estimated likely paths rather than exact paths.

Statistical analysis

Mobility patterns were analysed using distribution statistics, peak-period indicators, daily deviation detection, Spearman correlation and generalised linear modelling. Daily deviations were identified by comparing each observation with records from the same weekday during the preceding and following six weeks, excluding the selected observation from its own baseline. Records were shortlisted where the absolute z-score was at least 2, the percentage change was at least 20%, and the absolute count difference was at least 20. Weather sensitivity was assessed by comparing mobility volumes with temperature and precipitation. Academic-term effects were evaluated after accounting for weather and weekday effects.

Sensor comparison

Telraam and EnCLOD were compared at two locations where both datasets observed the same road segments. The comparison used matched temporal records and symmetric percentage-difference indicators, avoiding the assumption that either dataset represented ground truth. Extreme disagreement periods were defined where the disagreement was 30% or more.

Geovisualization

The processed outputs were integrated into an interactive Leaflet dashboard. Different visualization methods were selected for each dataset: graduated lines for EnCLOD road-segment counts, proportional doughnut markers for Telraam multimodal counts, and heatmap-style line visualization for Nextbike estimated cycling routes.

Implementation and deployment

The web application uses static CSV and GeoJSON files hosted through GitHub Pages. This approach was selected because it is reproducible, lightweight and accessible through a standard web browser. It also avoids dependence on specialised software or a server-side database, making the final dashboard easier to maintain beyond the completion of the diploma thesis.

Results

The results of the thesis are organised around six main outputs: the preparation of harmonised mobility datasets, the identification of mobility patterns within the AOI, the assessment of weather and academic-period effects, the identification of unusual daily deviations, the comparison of Telraam and EnCLOD measurements, and the development of the interactive mobility dashboard.

Together, these results show how heterogeneous mobility datasets can provide valuable insight into campus-scale mobility, but only when the variations between sources, temporal coverage, sensor logic and uncertainty are carefully considered.

Results / 01

Data preparation and harmonisation

The data preparation stage produced cleaned and dashboard-ready datasets from Telraam, EnCLOD, Nextbike and CHMI sources. Each dataset required a separate processing workflow because the original data differed in structure, spatial coverage, temporal resolution and recorded mobility type.

Nextbike records were filtered to retain only trips connected to the AOI. Trips with start and end coordinates within 30 m of each other were removed, as no meaningful journey could be inferred from them. After filtering, the dataset was reduced from 39,342 original records to 5,120 trips relevant to the study area. A least cost path algorithm was applied to estimate likely cycling routes between trip start and end points, using the NetAScore bikeability index to weight the cycling network.

Data quality assessment showed that each source had specific limitations. EnCLOD contained incomplete hourly observations, especially on Šmeralova. Telraam data were mostly complete in terms of uptime, but nighttime detections were not separated by mode. Nextbike provided origin-destination records but no observed trajectories. CHMI weather data were complete, but the station was located approximately 2 km from the AOI.

Results / 02

Mobility patterns

Analysis showed that mobility within the AOI varied across both space and time. EnCLOD sensors generally recorded higher daily mobility during regular teaching periods, especially during the Winter Semester. This indicated that the academic calendar was visible in the observed mobility patterns.

Differences were also identified between the two main observed streets. Šmeralova appeared more sensitive to academic-period changes, with lower mobility during the Main Holiday period. By contrast, 17. Listopadu remained relatively active during non-teaching periods, suggesting that it functioned not only as a campus-related street, but also as a broader urban mobility corridor during the study period.

Peak-period analysis showed that afternoon peaks were generally more stable than morning peaks. Morning peak times varied more strongly between sensors, locations and academic periods, indicating more flexible travel routines during exam periods and breaks.

  • Teaching periods were generally associated with higher observed mobility volumes.
  • Šmeralova showed stronger academic-calendar sensitivity than 17. Listopadu.
  • 17. Listopadu remained active during non-teaching periods.
  • Afternoon peaks were more stable than morning peaks.
  • Telraam showed clearer commuter-related peaks than EnCLOD.

Table 2 summarises the selected location-level indicators and peak-time findings.

Table 2. Selected mobility-pattern indicators by location, academic period and peak time
Mobility pattern Statistic Interpretation
17. listopadu South: In 4,797 to 6,411 average daily counts Increase from Summer Exam Period to Winter Semester.
17. listopadu North: Out 4,212 to 5,642 average daily counts Higher movement during the regular teaching semester.
Šmeralova South: In 905 to 972 average daily counts Smaller increase, but still higher during Winter Semester.
Šmeralova Middle: Out 156 average daily counts Lowest value during the Main Holiday period.
17. listopadu South: In during Main Holiday 5,380 average daily counts Shows that 17. listopadu remains active outside teaching periods.
Telraam 17. listopadu AM peak 07:00 Stable morning peak across available academic periods.
Telraam 17. listopadu PM peak 16:00 to 18:00 Shifted later from Winter Semester to Summer Semester.
Šmeralova North: Out AM peak 06:00 to 09:15 Greater variation, especially during exam and holiday periods.
Results / 03

Weather and academic-period effects

Weather analysis showed that active mobility modes were more sensitive to weather conditions than motor vehicles. Cycling was the most weather-sensitive mode in the observed data, especially during cold conditions, when cyclist volumes decreased substantially.

Temperature showed a stronger association with mobility than precipitation. Pedestrian and cycling volumes were more affected by temperature changes, while motor-vehicle volumes were comparatively less sensitive to weather conditions.

Generalised linear modelling showed that academic terms explained additional variation in daily mobility volumes after accounting for weather and weekday effects. This indicated that mobility in the AOI was shaped by both environmental conditions and the structure of the university calendar during the study period.

  • Cycling showed the strongest weather sensitivity.
  • Cold days were associated with a substantial decrease in cyclist volumes.
  • Temperature had a stronger relationship with mobility than precipitation.
  • Academic terms improved the explanation of daily mobility variation.

Table 3 summarises the main weather-sensitivity and academic-term modelling statistics.

Table 3. Weather sensitivity and academic-term modelling indicators
Mode / effect Statistic Interpretation
Cyclists Mean |ρ| = 0.305; max |ρ| = 0.744 Highest overall weather sensitivity.
Pedestrians Mean |ρ| = 0.296; max |ρ| = 0.486 Weather-sensitive, but with a lower maximum effect than cyclists.
Motor vehicles Mean |ρ| = 0.117; max |ρ| = 0.370 Least sensitive to weather conditions.
Temperature effect Pedestrians 0.476; cyclists 0.415; motor vehicles 0.175 Temperature showed stronger associations than precipitation.
Precipitation effect Pedestrians 0.116; cyclists 0.195; motor vehicles 0.059 Precipitation effects were weaker and less consistent.
Cold days and cycling Median change = -26.82% Cold days produced the strongest adjusted decrease in cycling volumes.
Precipitation and cycling Median change = -12.97% Rain was associated with lower cycling volumes, but less strongly than cold days.
Academic term controls Improved 100% of pedestrian and cyclist models; 90% of motor-vehicle models Academic calendar effects remained important after accounting for weather and weekday.
Median ΔAIC improvement Pedestrians 68.26; cyclists 7.36; motor vehicles 32.38 Academic terms added most explanatory value for pedestrians.
Results / 04

Daily deviations

Daily-deviation analysis was used to identify unusually high or low daily mobility observations. Each observation was compared with values recorded on the same weekday during the preceding and following six weeks, excluding the selected day itself. A record was shortlisted only when its absolute z-score was at least 2, its percentage change was at least 20%, and its absolute count difference was at least 20.

The shortlisted observations represent days requiring further investigation rather than confirmed event impacts or sensor errors. Deviations were uncommon, accounting for fewer than 10% of observations in each dataset, and overlap between the three data sources was limited.

The analysis identified 70 unique EnCLOD deviation days, 25 Telraam days and 11 Nextbike days. Of these, 20 EnCLOD dates, six Telraam dates and one Nextbike date corresponded with selected local events or Czech public holidays. No date appeared as a deviation in all three datasets, suggesting that many unusual values were specific to a transport mode, data source or monitoring location. As such, the results represent a shortlist for investigation, rather than evidence of causation.

Results / 05

Telraam and EnCLOD comparison

The comparison between Telraam and EnCLOD datasets at two locations where both sensor types observed the same road sections showed that datasets with similar spatial coverage should not automatically be treated as equivalent measurements.

A weighted nighttime adjustment was applied to Telraam data to account for unclassified nighttime detections which improved agreement between Telraam and EnCLOD, especially at the side location. However, substantial disagreement remained at the front location, suggesting that other local or sensor-specific factors influenced the comparison. Table 4 outlines the main qualitative comparison findings.

Table 4. Qualitative comparison findings for Telraam and EnCLOD
Comparison finding Interpretation
EnCLOD was usually higher than Telraam The direction of disagreement was consistent, especially at the front location.
Side location showed better agreement Disagreement was lower and improved with broader temporal aggregation.
Front location retained high disagreement Systematic local or sensor-specific factors likely influenced the results.
Volume did not explain disagreement consistently Higher traffic volumes did not always lead to higher disagreement.

The comparison supports the decision to treat Telraam and EnCLOD as complementary datasets rather than merging them into a single combined mobility count. Table 5 summarises the detailed quantitative disagreement results.

Table 5. Quantitative Telraam–EnCLOD disagreement results before and after adjustment
Comparison result Front location Side location Interpretation
Extreme disagreement before adjustment 276 periods 138 periods Large disagreement existed before adjusting Telraam nighttime values.
Extreme disagreement after adjustment 171 periods 17 periods The weighted nighttime adjustment improved agreement at both locations.
Change after adjustment -38% -88% Improvement was much stronger at the side location.
EnCLOD higher at daily level 98.95% 72.92% EnCLOD was usually higher than Telraam, especially at the front location.
EnCLOD higher at term level 100% 66.67% The direction of bias remained visible after aggregation.
Median ASPD range 32.8% to 36.8% 8.1% to 10.9% Typical disagreement was much higher at the front location.
Extreme disagreement at daily level 57% 7% Daily front-location disagreement was frequently at or above the 30% threshold.
Extreme disagreement at term level 100% 0% Aggregation did not solve the front-location bias, but removed side-location extremes.
Results / 06

Interactive dashboard

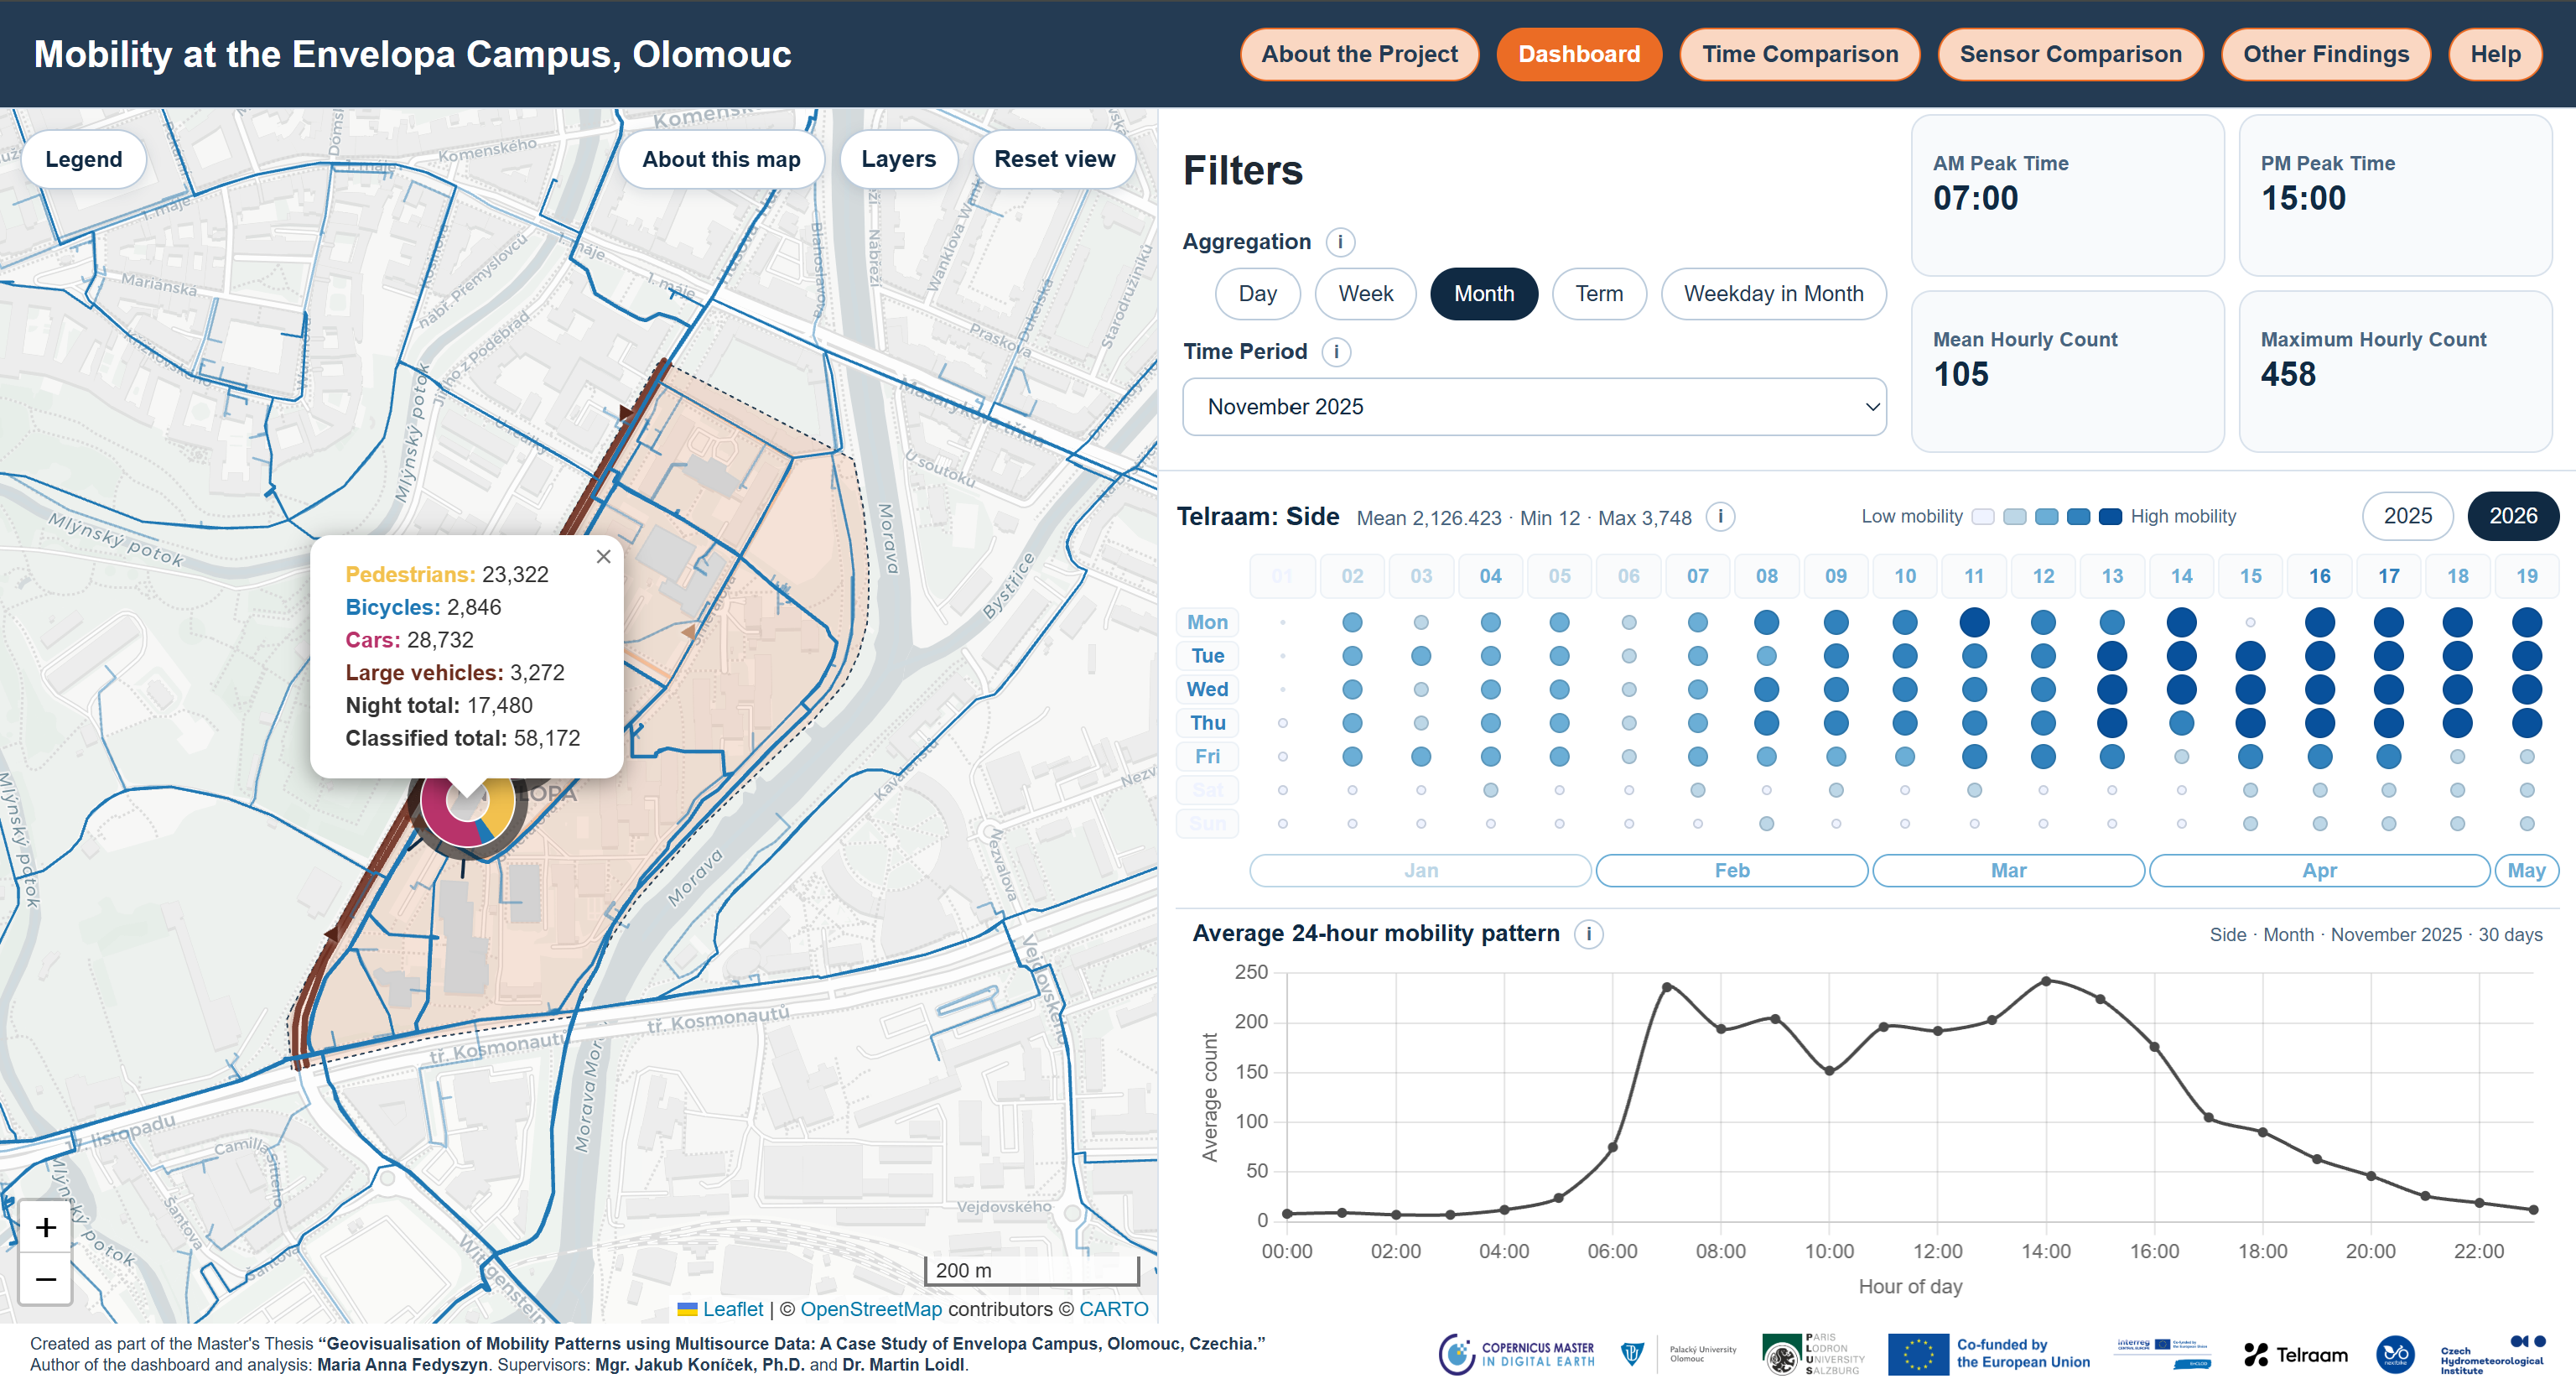
The practical output of the thesis is an interactive web map dashboard designed to communicate the findings of the thesis, regarding mobility patterns within the Envelopa Campus, clearly and accessibly. It presents the three mapped mobility datasets: EnCLOD, Telraam and Nextbike, together with analytical findings derived additionally from CHMI weather observations.

The website has six pages, allowing users to move from general project context and interactive data exploration to statistical findings, sensor evaluation and supporting guidance.

  • About the Project introduces the study area, mobility datasets, data coverage and research context.
  • Dashboard presents spatial mobility patterns, selected-period indicators, annual daily trends and average 24-hour mobility profiles.
  • Time Comparison provides a split-map interface for comparing mobility between two independently selected periods.
  • Sensor Comparison examines the magnitude, direction and frequency of disagreement between matched Telraam and EnCLOD observations.
  • Other Findings presents the results of the weather-sensitivity, adjusted weather-effect, daily-deviation and academic-term analyses.
  • Help provides page-specific tutorials, interpretation guidance and answers to frequently asked questions.

The application is intended for users who may not have a technical background in geoinformatics or mobility analysis. Information buttons, legends, interpretation panels and help materials are used to explain the displayed measures and reduce the risk of treating the different datasets as directly interchangeable.

Click on Figure 2, below, to visit the interactive web map dashboard.

Interactive web map dashboard showing mobility patterns at the Envelopa Campus in Olomouc
Figure 2: The interactive 'Mobility at the Envelopa Campus, Olomouc' web map dashboard
Results / 07

Key outputs

The thesis produced both analytical and practical outputs. These outputs demonstrate how heterogeneous mobility data can be processed, compared and visualized while still communicating uncertainty, incompleteness and source-specific limitations. Key outputs can be summarised as follows:

  • Review of existing mobility monitoring methods, data integration and mobility geovisualization techniques.
  • Cleaned and harmonised Telraam, EnCLOD, Nextbike and CHMI datasets.
  • Data temporally aggregated by day, week, month, weekday in month and academic term.
  • Estimated Nextbike cycling routes using a least generalised cost-path approach.
  • Analysis of academic-period mobility variation and 24-hour mobility profiles.
  • Weather sensitivity analysis for active modes and motor vehicles.
  • Identification of unusual daily observations using a moving same-weekday baseline, followed by comparison with selected local events and Czech public holidays.
  • Comparison of Telraam and EnCLOD counts at shared road sections.
  • Interactive web map dashboard to explore identified mobility patterns.

Overall, the results provide a multisource overview of mobility within the Envelopa Campus and a transferable workflow for responsible campus-scale mobility analysis.

Conclusion

This diploma thesis demonstrated how heterogeneous mobility datasets can be used to analyse, compare and communicate campus-scale mobility patterns within the Envelopa Campus of Palacký University Olomouc. By combining Telraam, EnCLOD, Nextbike and CHMI data, the study provided a broader understanding of mobility than any single dataset could offer alone.

The analysis showed that mobility in the AOI is shaped by both university-related activity and wider urban movement. Teaching periods were generally associated with higher mobility volumes, while Šmeralova was more strongly linked to academic-calendar effects and 17. Listopadu functioned more as a broader urban corridor. Daily profiles showed more stable afternoon peaks, whereas Telraam data captured clearer commuter-related patterns due to its multimodal structure.

Weather conditions affected active transport modes more strongly than motor vehicles. Cycling was particularly sensitive to cold conditions, and precipitation was often associated with lower cycling volumes, although less consistently. Including academic terms in the statistical models improved the explanation of mobility variation, confirming that mobility in the AOI is influenced by both environmental conditions and the university calendar.

Daily deviations were uncommon across the three mobility datasets and showed limited overlap. Only a minority coincided with selected local events or public holidays, and no date appeared as a deviation in all three datasets. These observations therefore provide a shortlist for further investigation rather than evidence of causation.

The comparison of Telraam and EnCLOD data showed that datasets observing the same road sections should not be treated as equivalent without careful evaluation. Differences in sensor placement, classification logic, field of view, completeness and observation method produced substantial disagreement. Although the weighted nighttime adjustment improved agreement, especially at the side location, notable differences remained at the front location.

The final interactive dashboard presents processed data, maps, temporal charts, mobility indicators and comparison outputs in an accessible browser-based format. Its use of open formats, static files and GitHub Pages supports reproducibility and long-term accessibility.

Overall, the thesis met its objectives by reviewing multisource mobility approaches, collecting and harmonising heterogeneous datasets, analysing mobility patterns and data limitations, and creating an interactive web map dashboard. The work provides both a practical tool for exploring Envelopa Campus mobility and a transferable workflow for responsible multisource mobility analysis, comparison and visualization.