Methodology
Settlements dispose of an increasing number of mobility data provided by sensors. Therefore, the purpose and potential applications of the automation of mobility data are in the sphere of infrastructure development. The tool for automation aims for any type of study area. Primarily the area is determined by the input data. To show the capabilities, the tool has been tested in three different case studies.
The tool for automation of GPX data to the linear layer of passage frequencies consists of the following parts: parametrization and data acquisition, map matching, post-processing, result visualization and storage. In the following figure is a general overview of the automation workflow showimg preliminary processing steps resulting in two main outputs – web map and geodata. The figure outlines workflow diagram and Python packages within the workflow.
Tool Documentation and Distribution
Documentation and distribution are the most important aspects for the further use of the tool. The overall presentation has to communicate the tool's capabilities. The level of detail in documentation varies based on the platform and the target user group. Most trivial commentaries are in the Voilà web application interface, one can proceed to detailed documentation through a hyperlink. The GitHub start page introduces the workflow and the solutions in more general terms. The Jupyter Notebook together with the thesis provides the most detailed documentation and instructions for the experienced users.
Testing and Assessment
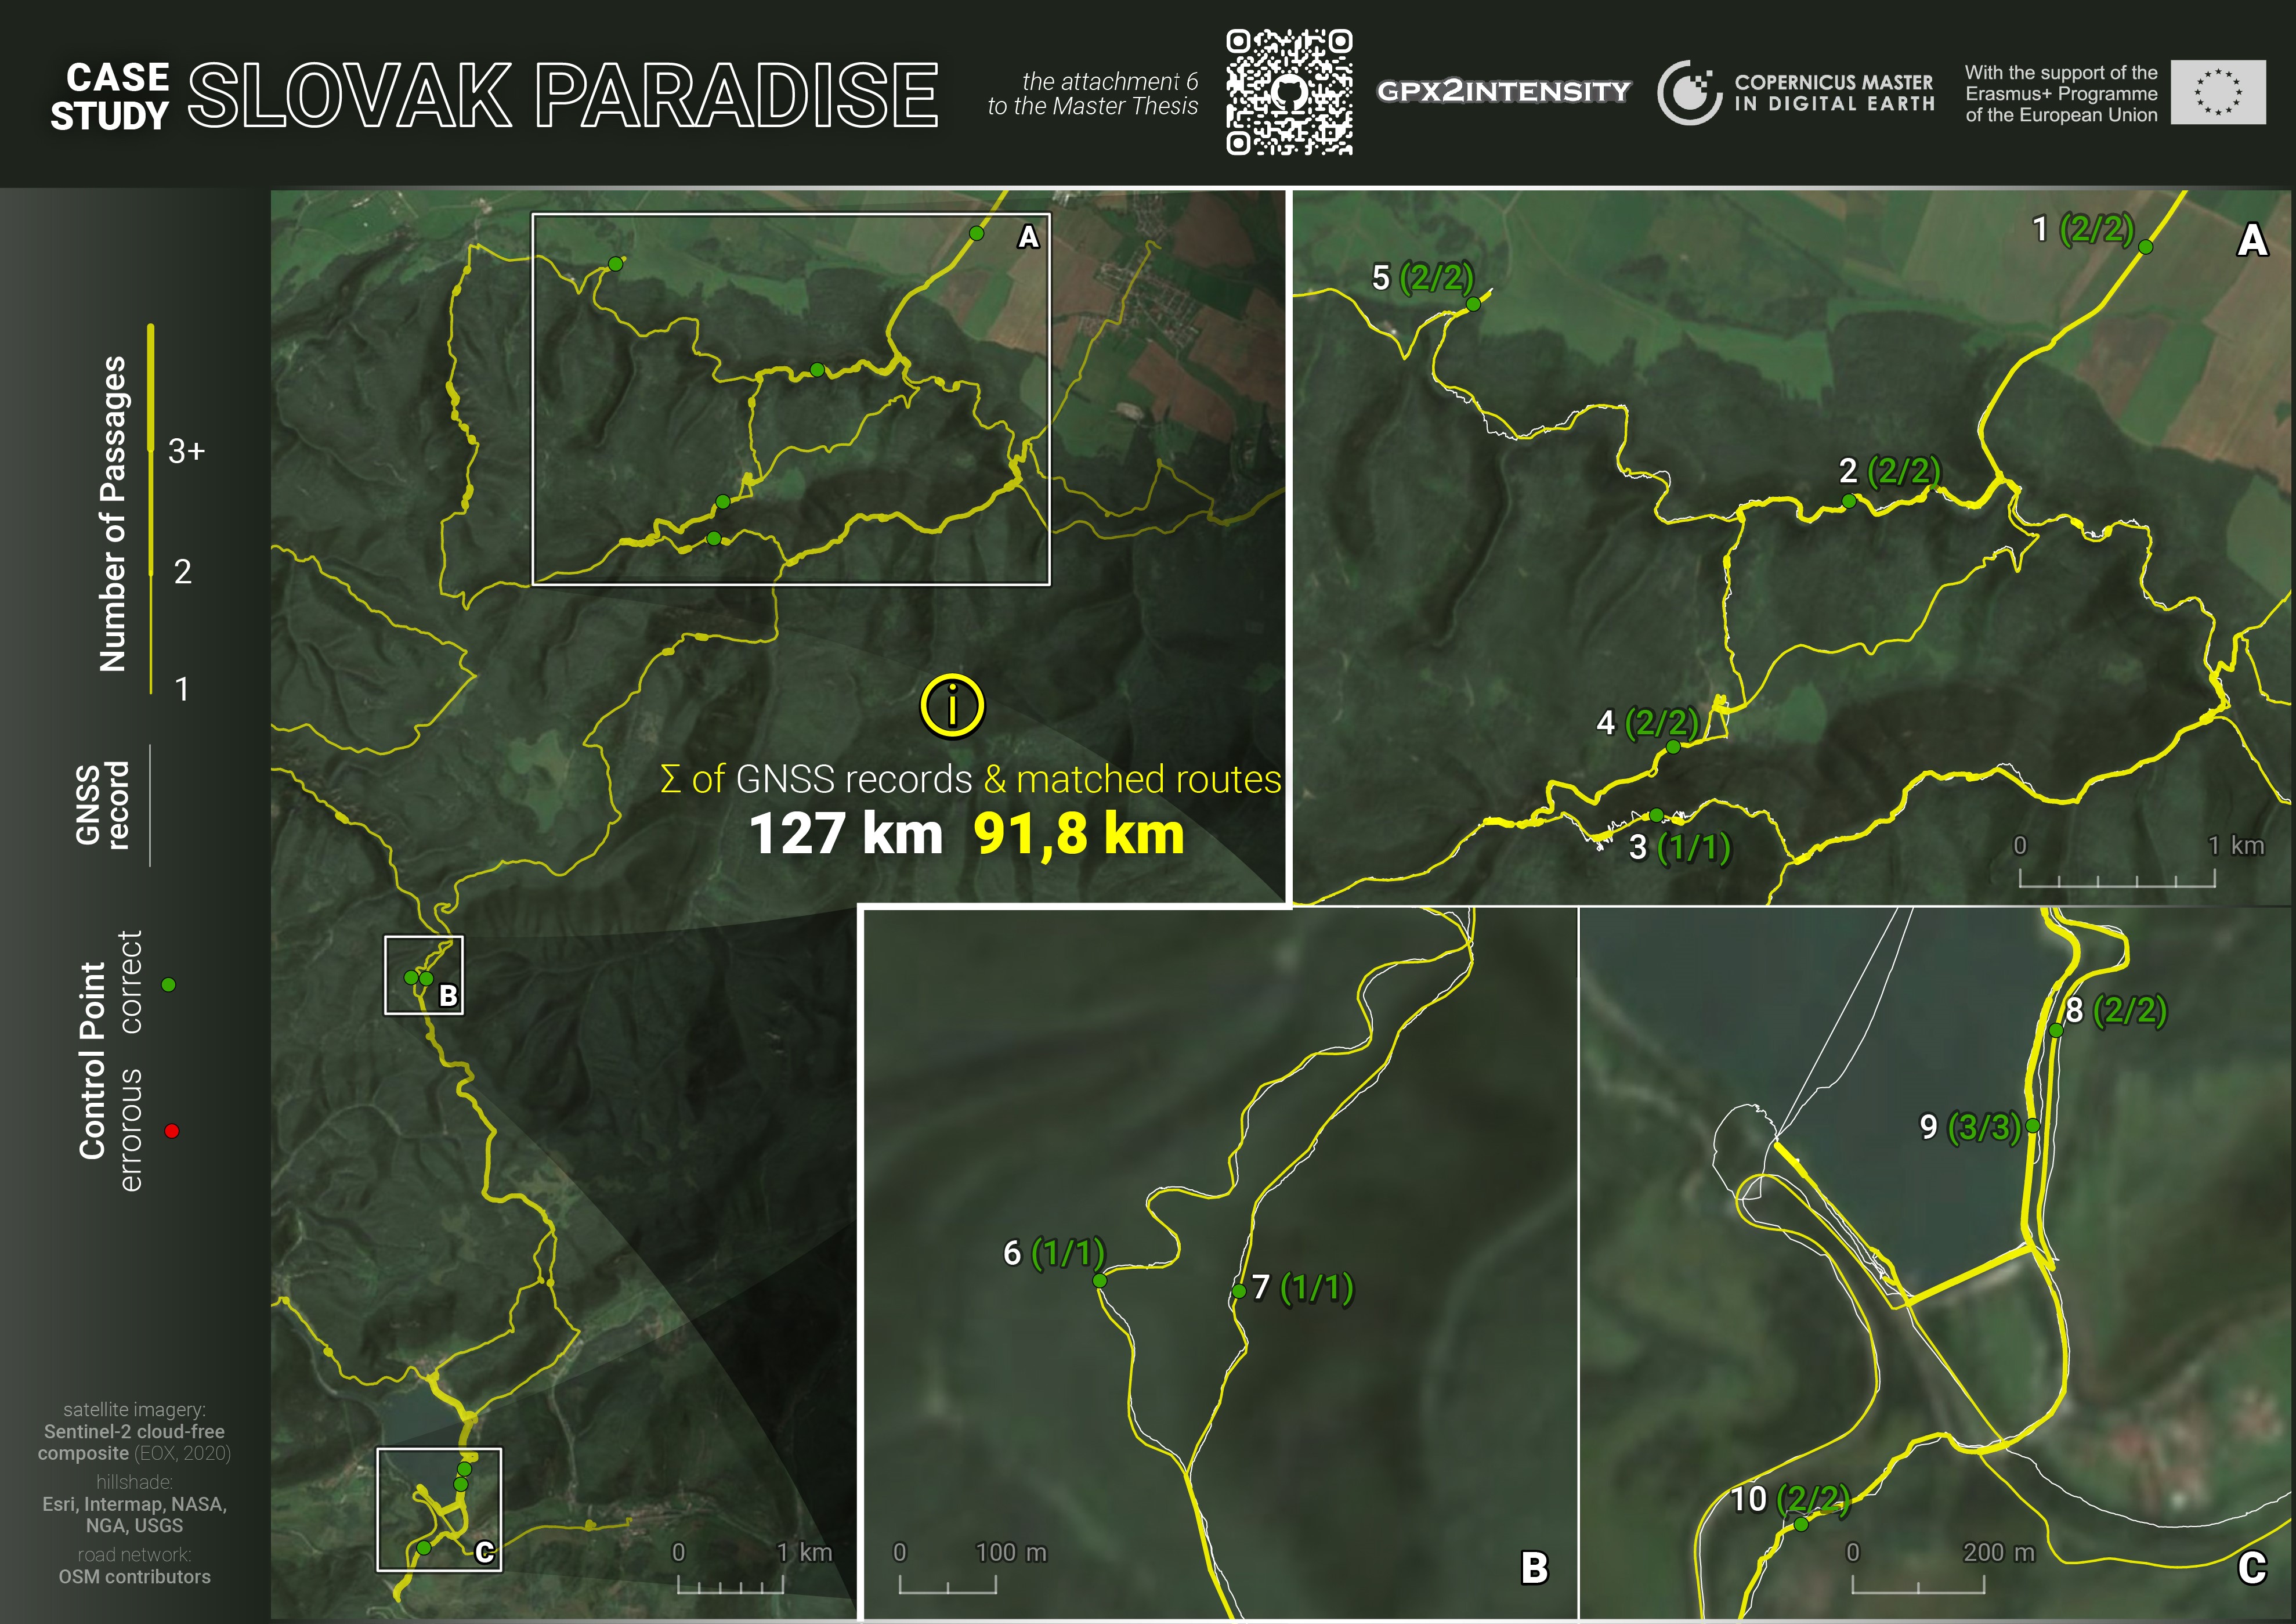
The possibilities of cloud-based tools are wide. Therefore, it is essential to determine the scope and limitations of the tool for possible use cases. The testing and assessment part consists of three case studies: in urban, mixed rural and mountainous, and rugged natural environments. Each case study aims to find suitable parameterisation for the area. Secondly, the best representative output result has been assessed in the frequency correctness rate.


