Methodology
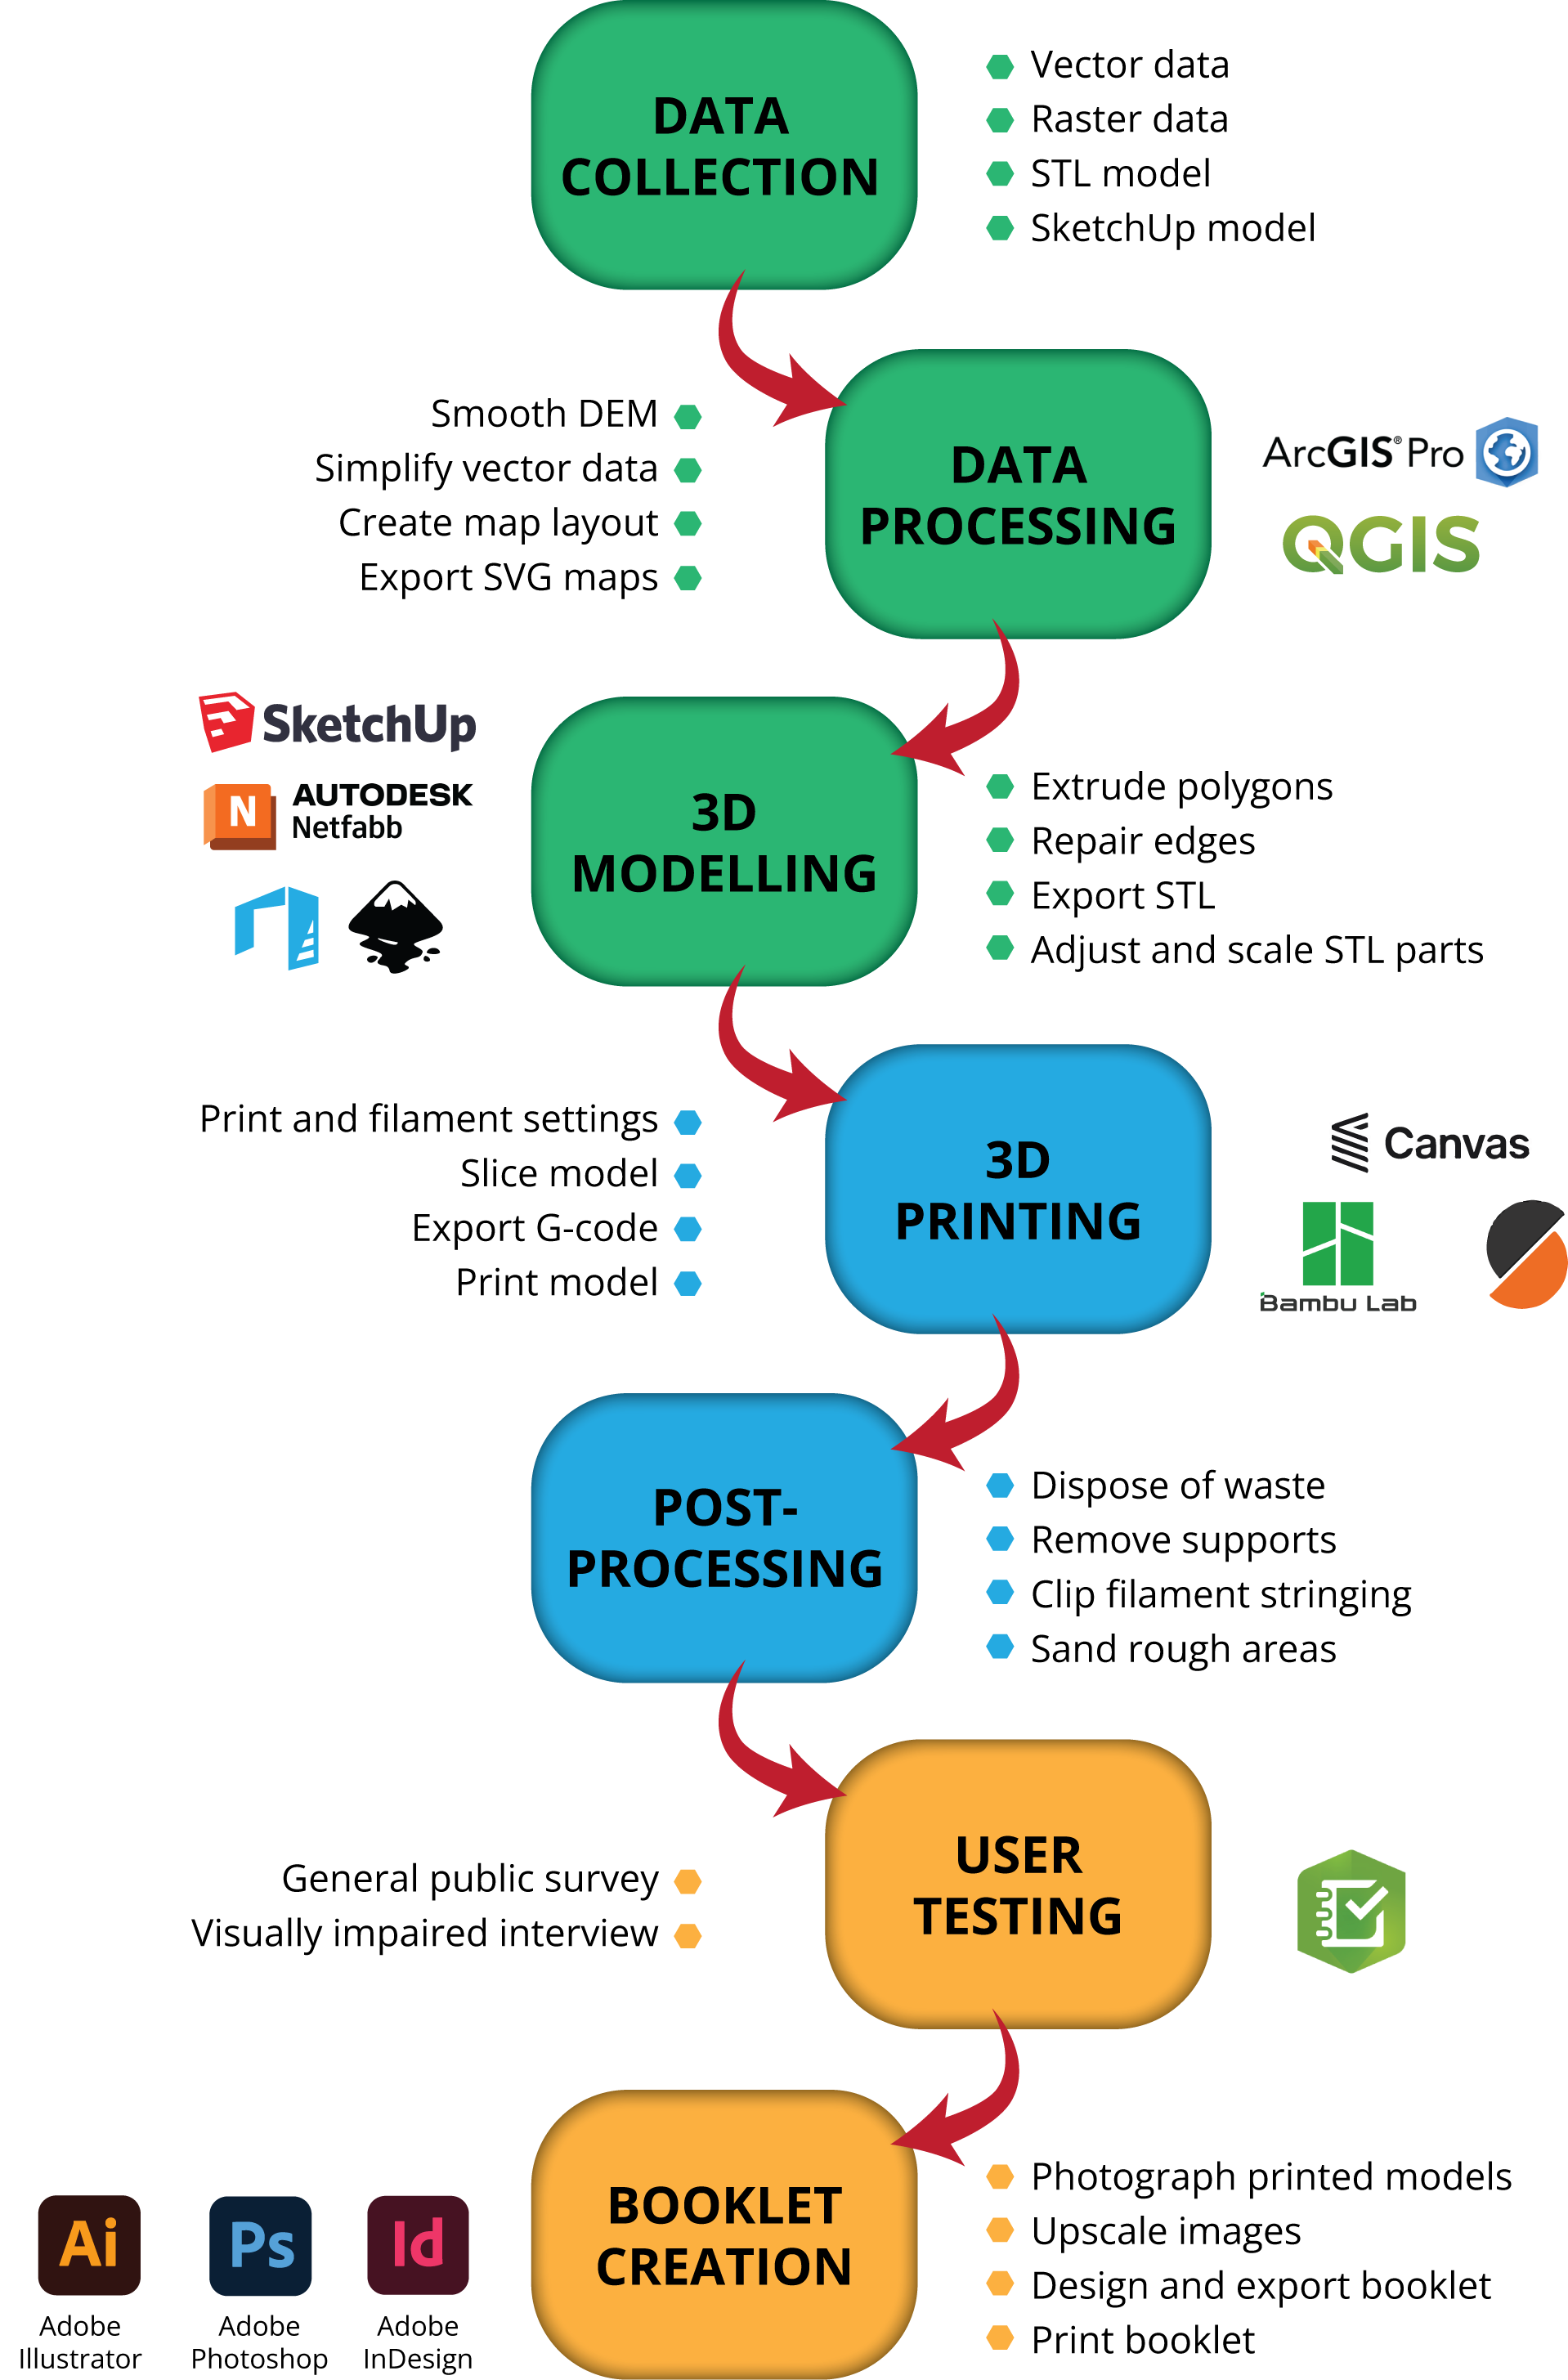
The research on multicolour 3D geovisualisations was divided into two primary phases: first, the creation or acquisition of 3D models, and second, the printing of these models using various equipment.
During the creation phase, the process began with ideation and data acquisition. Utilising Geographic Information System (GIS) software, data was processed to extract necessary components and perform operations such as smoothing Digital Elevation Models (DEMs) and simplifying complex geometries. The GIS software was also instrumental in generating a comparative paper map used in the subsequent user testing. Processed data was then exported to 3D modelling software to craft the desired models, which were further refined using 3D model viewer software.
The printing phase involved configuring and slicing the finalised models using specialised slicer applications tailored to the specific printer. Sliced models were transferred to the printer via USB drive or WLAN, and filament colours were prepared for printing. Throughout the printing process, periodic checks were conducted to ensure smooth progress. Upon completion, printed models underwent post-processing to remove any excess material, with the waste material quantified and recorded for analysis. Each printed model was photographed for inclusion in the multicolour printing booklet.
User testing was conducted using ArcGIS Survey123 to gather responses from participants. Finally, Adobe InDesign was employed to design the booklet, which was printed at the Palacký University Press and made available in both print and digital formats for web viewing. The complete workflow can be seen below.
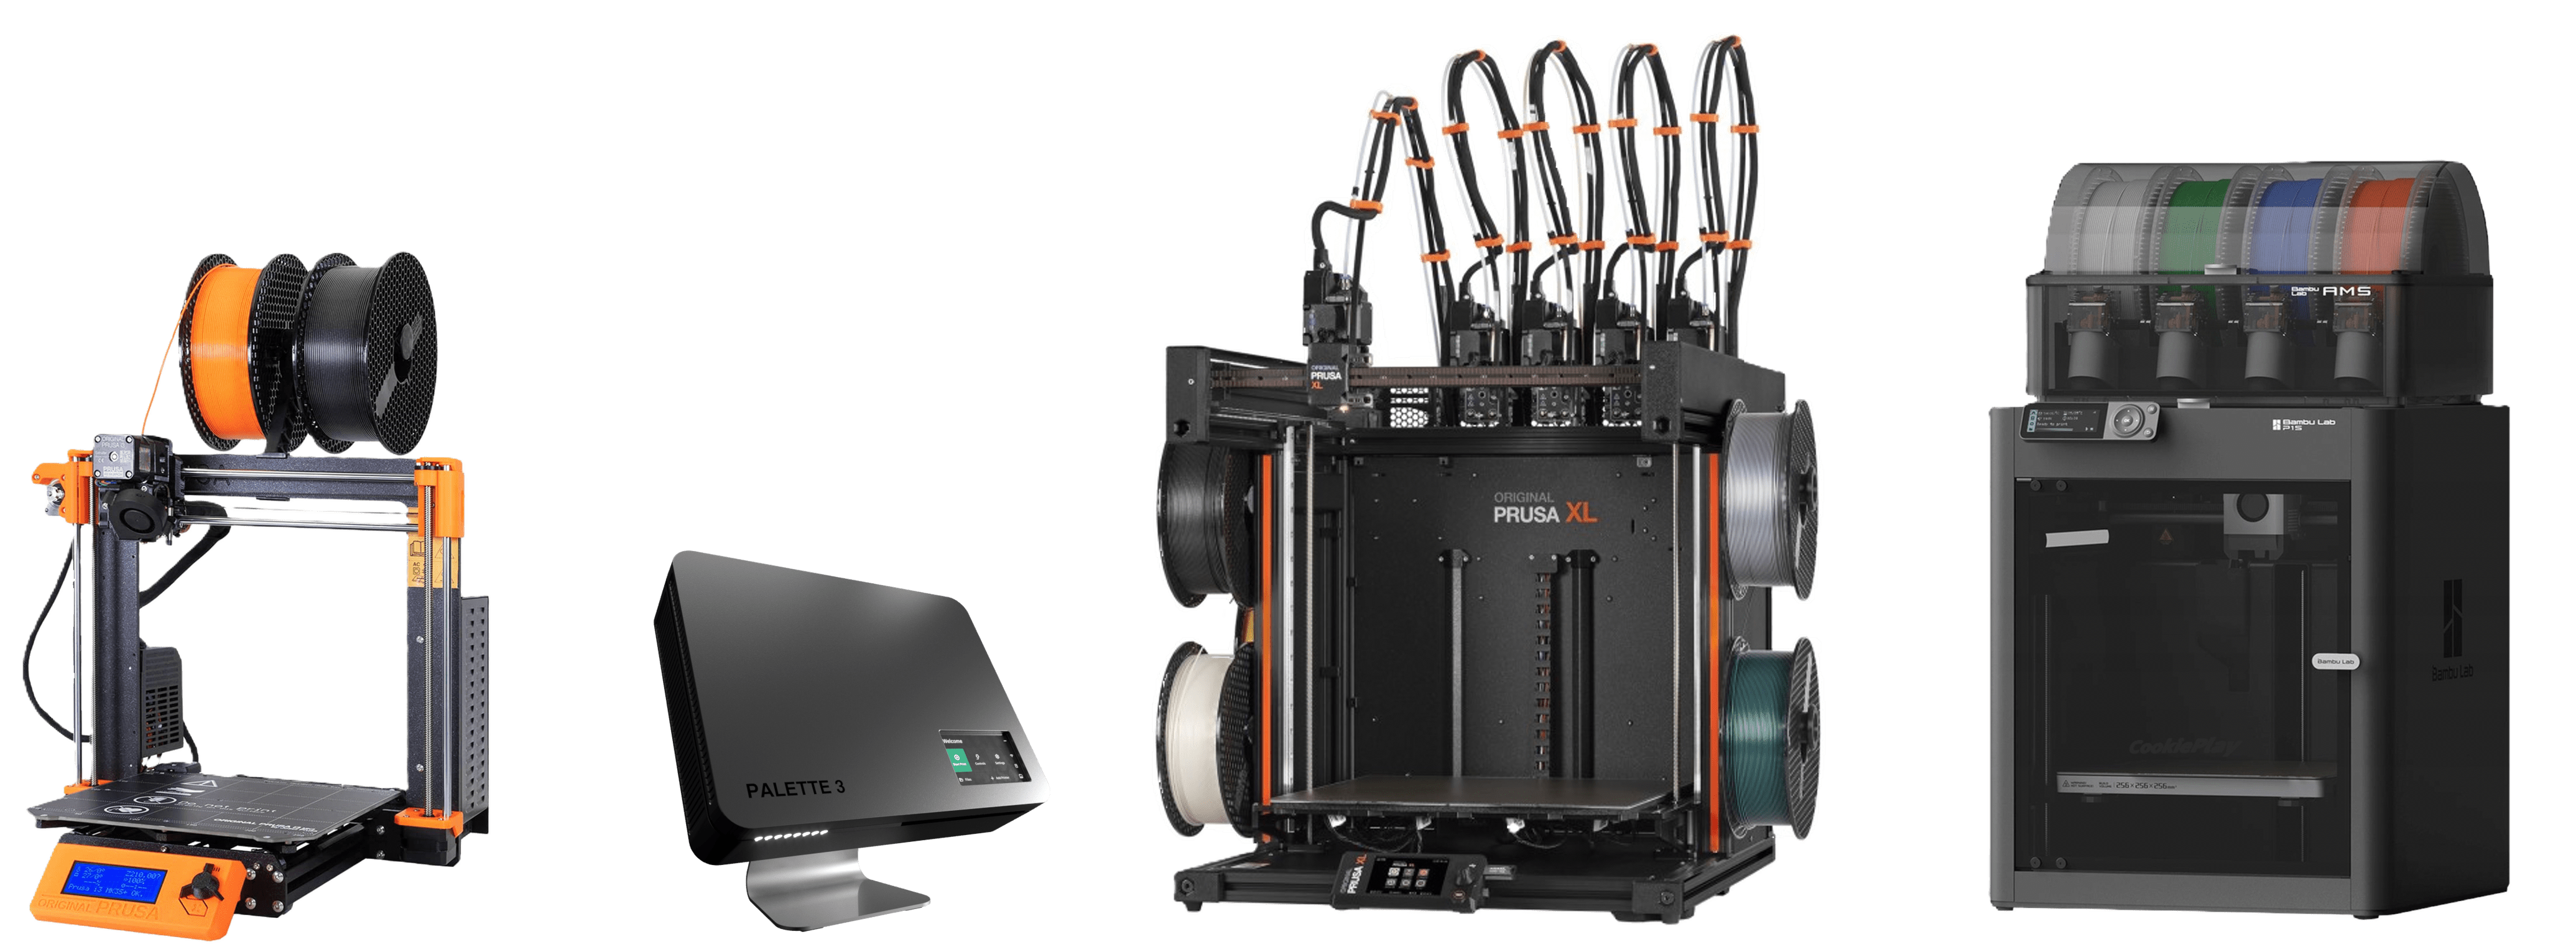
Equipment
Workflow