Summary
The main concern of the Bachelor’s Thesis was to describe the theory of Chi square tests and then apply this theory to the practical a data set. In first part was necessary to study literature and pass the study, which involved applications of Chi square tests in the ArcMap. Then could be made the part of theory.
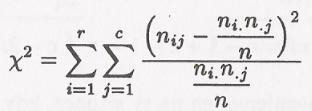
The theoretical part is divided into several parts. In an introductory chapter is explaining the theory of tests for normality, namely the graphical visualization because of the Chi square test is one of the tests of normality. Some of these graphical visualizations can be performed using the Geostatistical Analyst. For comparison, in the text is an example of more graphic capabilities of testing for normality using ArcMap software, R-project and Microsoft Excel. Pivotal chapter is devoted to the Chi square tests. It is possible to find there a formula for calculating the normality test and the test of independence and an explanation of what and under what conditions is possible to use these tests. The theory is supplement by the description of a sample contingency table because the tests of independence are calculates for the independence of contingency tables. For all these tests and graphs are also described their use or creation of different software. In the thesis are compared software ArcMap, R-project, Microsoft Excel and IDRISI version Taiga.
Described theory is then applied to the acquired data set. During the thesis the data is further described, including form of collection. On these data were tested for normality and various dependencies. It was first performed on data from numerical tests, then test was graphically expressed by maps outputs. In the mathematical task were used Shapiro-Wilkoxon test for testing normality, where the majority of the data showed abnormal distribution. For certain data has been demonstrated normality. But it was only a minimal sample and there for could be for these data use the same test of independence. Independence was tested using Kruskal Chi square test. Where verifying the number of embarking passenger and disembarking passengers on specific bus stops or a specific time of the day was demonstrated dependence. It was also necessary to test whether these passenger numbers also depend on a weekday. Since the measurement was made in a few days would be needed to confirm the independence of these data. Using Kruskal Chi square was demonstrated this independence. This test was one of the key tests that were needed to make on these data. The last test was used Wilkoxon test, which enabled a group of bus station which are similar in distribution of embarking or disembarking passengers through the day.
Graphic outputs were generated for only a few lines of public transport. The data were divided into three parts, each corresponding to the time of the day – at morning, afternoon and the evening. Subsequently were created three maps outputs for each part of the day and three maps outputs include data of the whole day. One map output is expressed in percentage of embarking and disembarking passengers at various bus stops. Line route is shown using method of ribbon, which represents the number passengers who were in the bus between the bus stops. In the other two maps outputs were used the cartodiagrams, which represents embarking respectively disembarking passenger at various bus stops. Using different shades of cartodiagrams are shown the bus stops in the direction into the city centre and the bus stops in the direction out of the city centre.
Univezita Palackého v Olomouci, Přírodovědecká fakulta, Katedra Geoinformatiky