Methods Used and Processing Procedure
This section represent the methods and procedure used to achieved defined objectives
Study Area
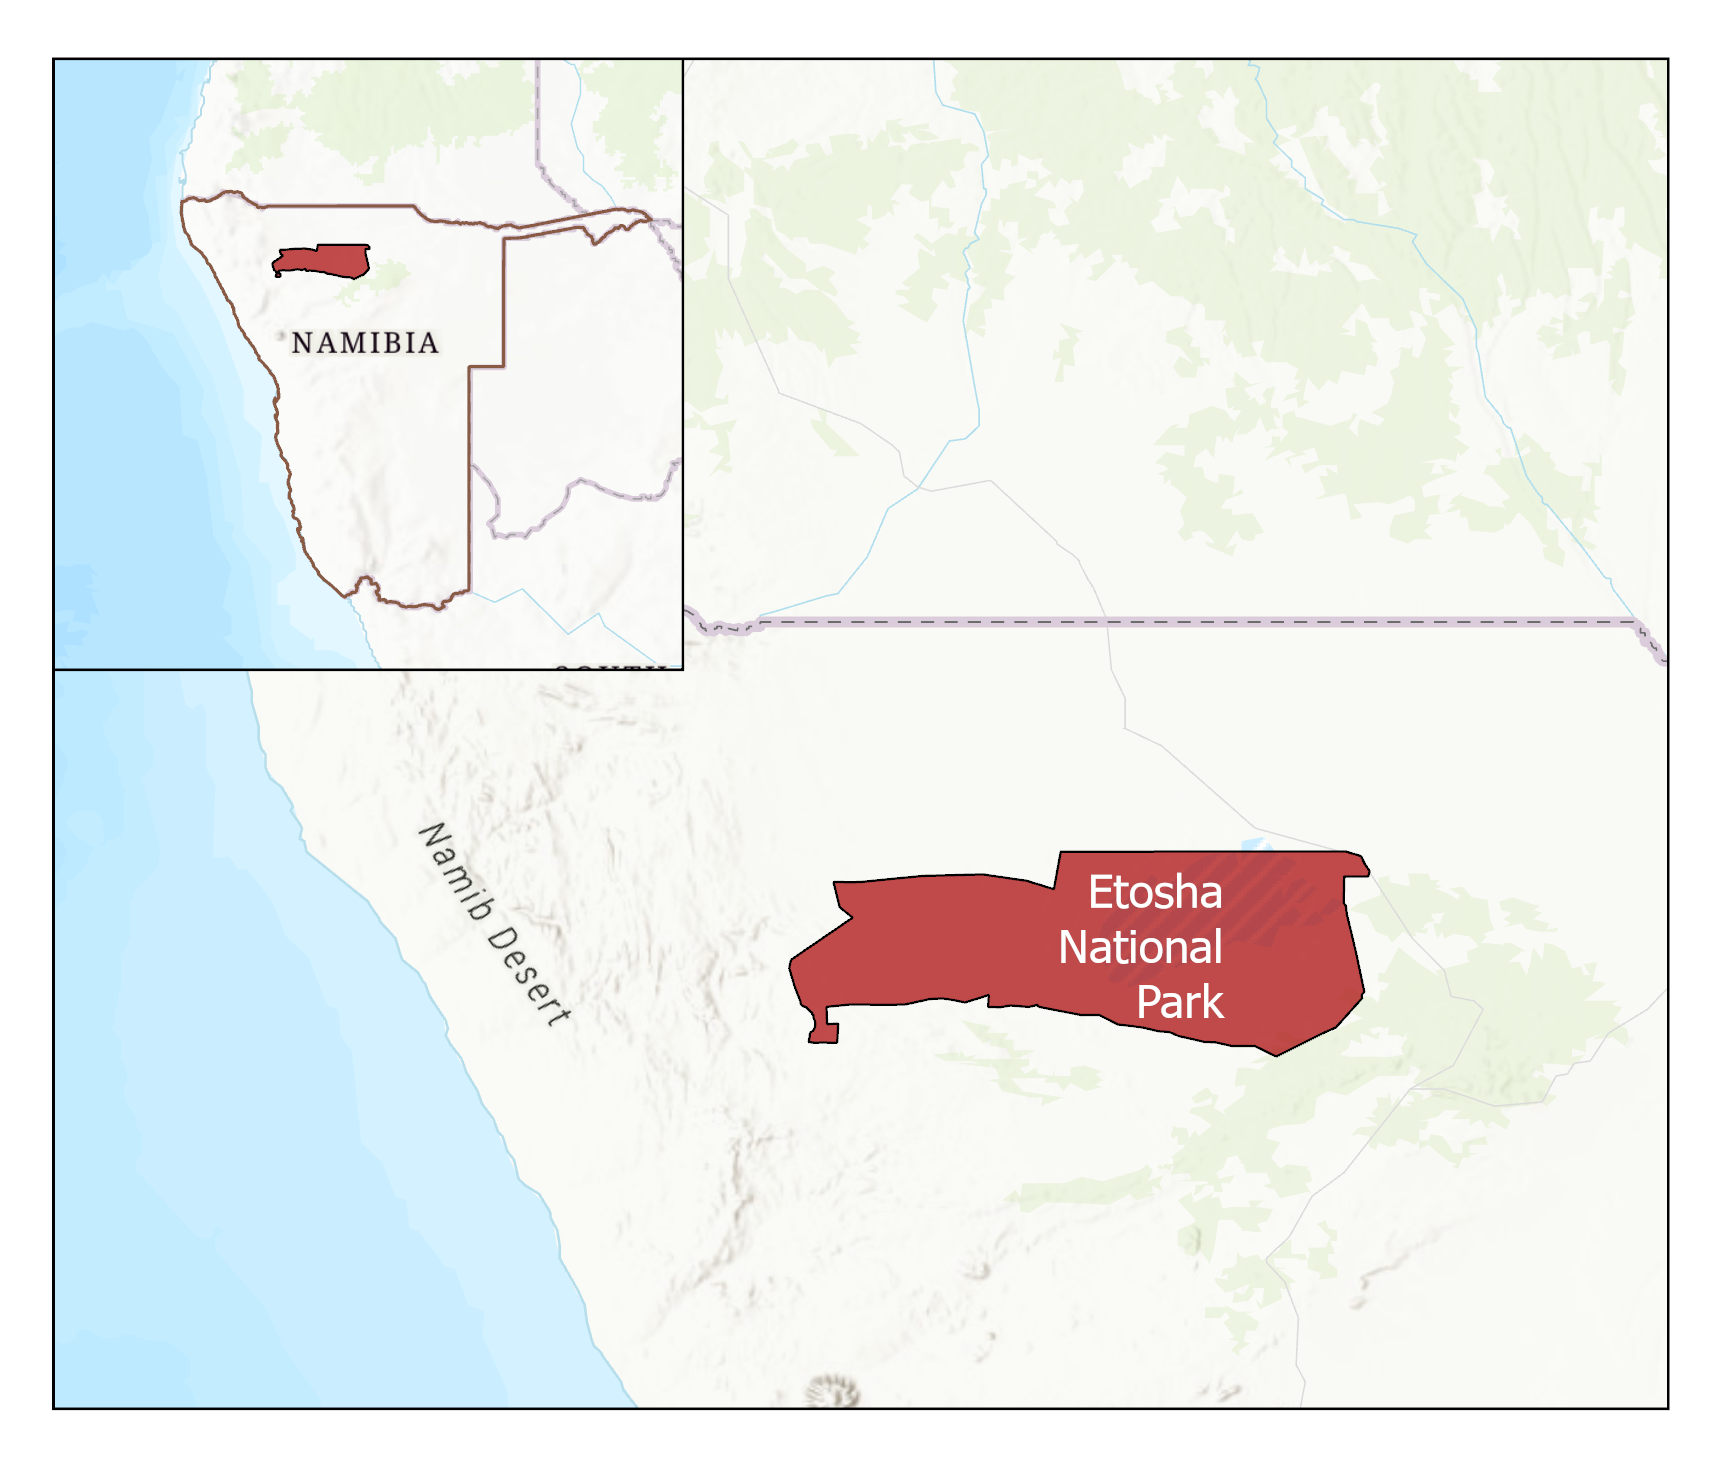
The study area selected for this research is Etosha National Park, which is in the northwest part of Namibia as shown in the figure below. This park covers an area of 22,937 km², is the most popular tourist destination in Namibia, and is considered one of the largest wildlife sanctuaries in the world (Dieckmann, 2023). The word Etosha means 'big white place' in the Ovambo tribe language, and that tribe used to live inside the park and the area around it in the 18th century. Earlier, this park was considered a game reserve, but over the years, after wars and political shifts on the African continent, it was declared a national park by the administration of South Africa in 1967.

Methods Used and Processing Procedure
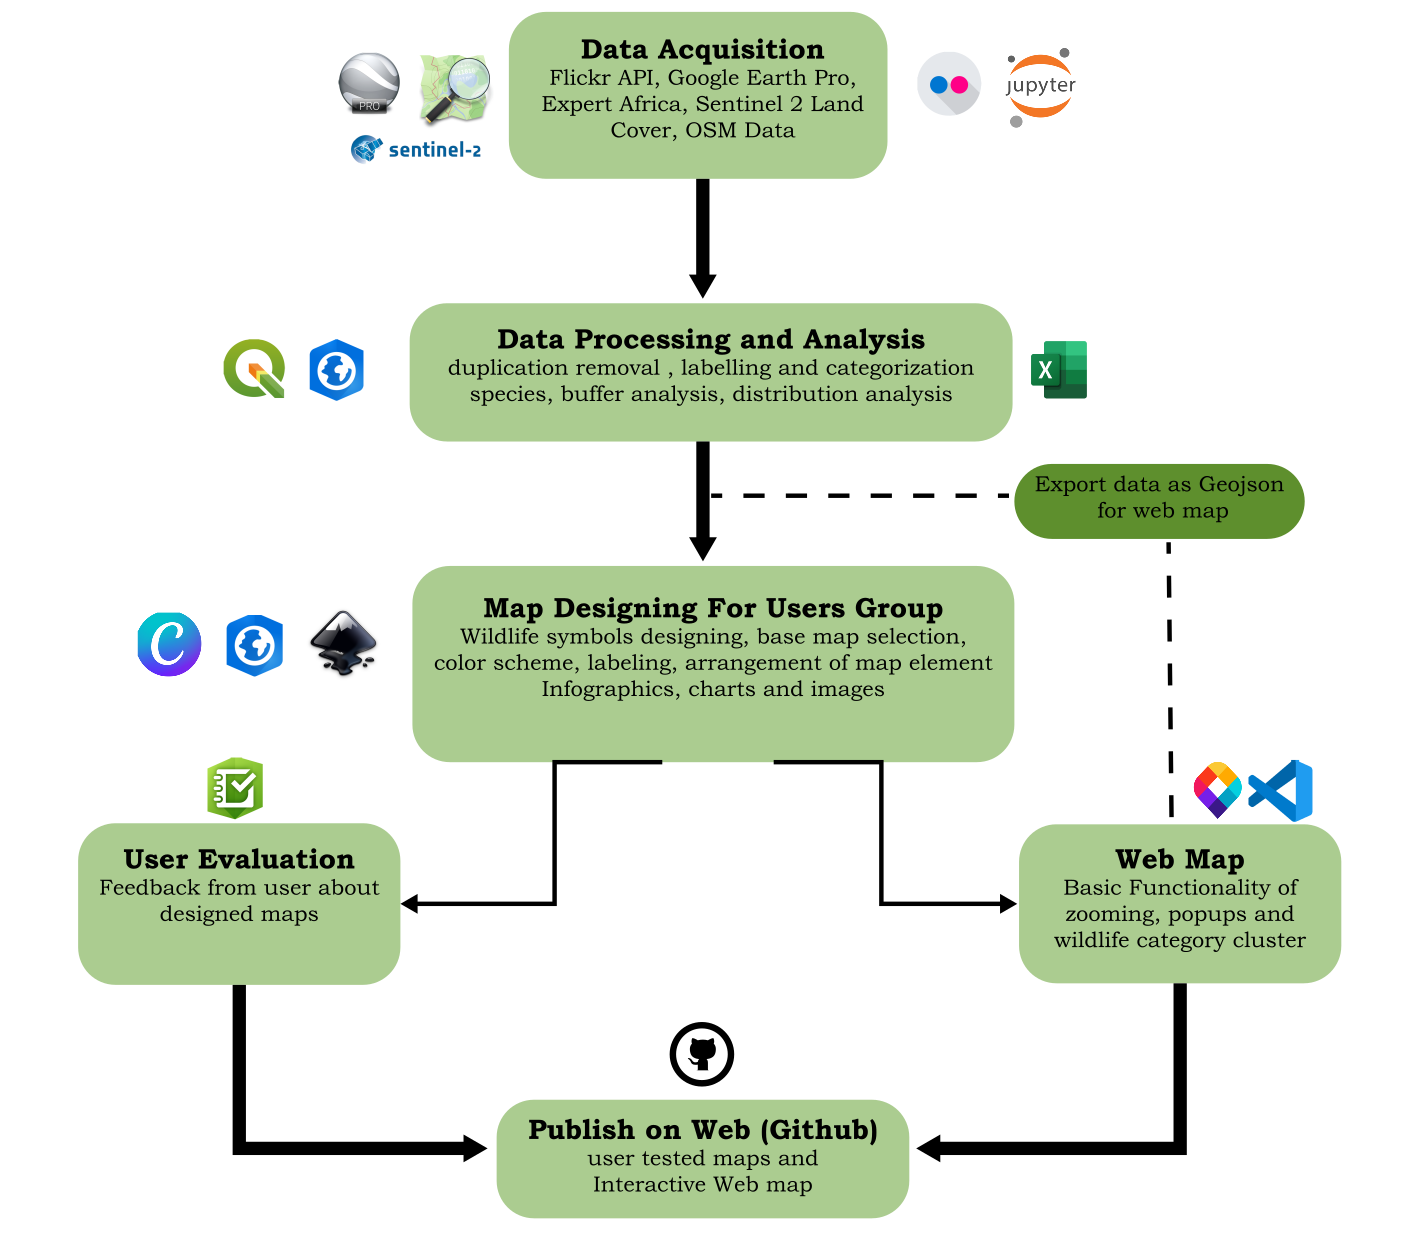
Before designing maps, a proper geotagged image acquisition method and
processing procedure were selected based on an extensive literature review to
understand what is publicly available online in terms of wildlife geotagged
image resources. The extraction of wildlife geotagged images is done in two
ways: first, using a non-commercial API from Flickr, and second, manually from
Google Earth Pro. The wildlife data was then preprocessed in terms of
duplication, labeling of species, and their trophic level of categorization.
Another key aspect of the research is to visualize the species distribution
around different waterholes in the park, so buffer analysis is also done.
Additionally, dot density analysis was done to analyze the distribution of
wildlife species in Etosha National Park.
Cartographically designed maps for different user groups are another key aspect
of this research. Each map was designed based on the technological and
cartographic knowledge of user groups, which include the public, experts, and
young people. The design part of this research had two sub-stages. In the first
stage, the main content of the map was prepared in ArcGIS Pro in terms of
assigning symbols to layers, base map selection, color scheme, and labeling. In
the second stage, the arrangement of map elements and infographic incorporation
were done in Inkscape software. User evaluation was then carried out on the
public, experts, and younger groups using Survey123 for feedback and to evaluate
the map design.
The user-tested map is then published on the web platform combined with an
interactive map that allows users to dynamically interact with different
features of the park. The interactive was made using HTML, CSS, JavaScript, and
a leaflet that visualizes basic functionality, e.g., zooming in and out of a map
or clickable features and pop-ups. The general workflow is pictured below in the
figure .

Data Used
Sentinel 2 Land Cover, Flickr API and Google Earth Pro for Wildlife Geotagged Images, Open Street Map, Widlife Statistics from Ministry of Environment Namibia
Software Used
QGIS, ArcGIS Pro, Inkscape,Canva, Freepik platform, MapTiler Cloud for data hosting, Visual Code Studio, GitHub, Survey123