RESULTS
This section represent the result and output of this research
There were two outputs from this research: one was a static map designed for different users, and the other was an interactive web map. The three different cartographic-style maps for younger people, the public, and experts provided detailed information related to the wildlife species around each waterhole and the landscape features of Etosha National Park. Each map was designed using different color schemes, basemaps,infographics, intuitive icons for wildlife species, and landscape feature symbology of the park. The textual information related to the park was a bit different on each map, considering the background knowledge of each target group.
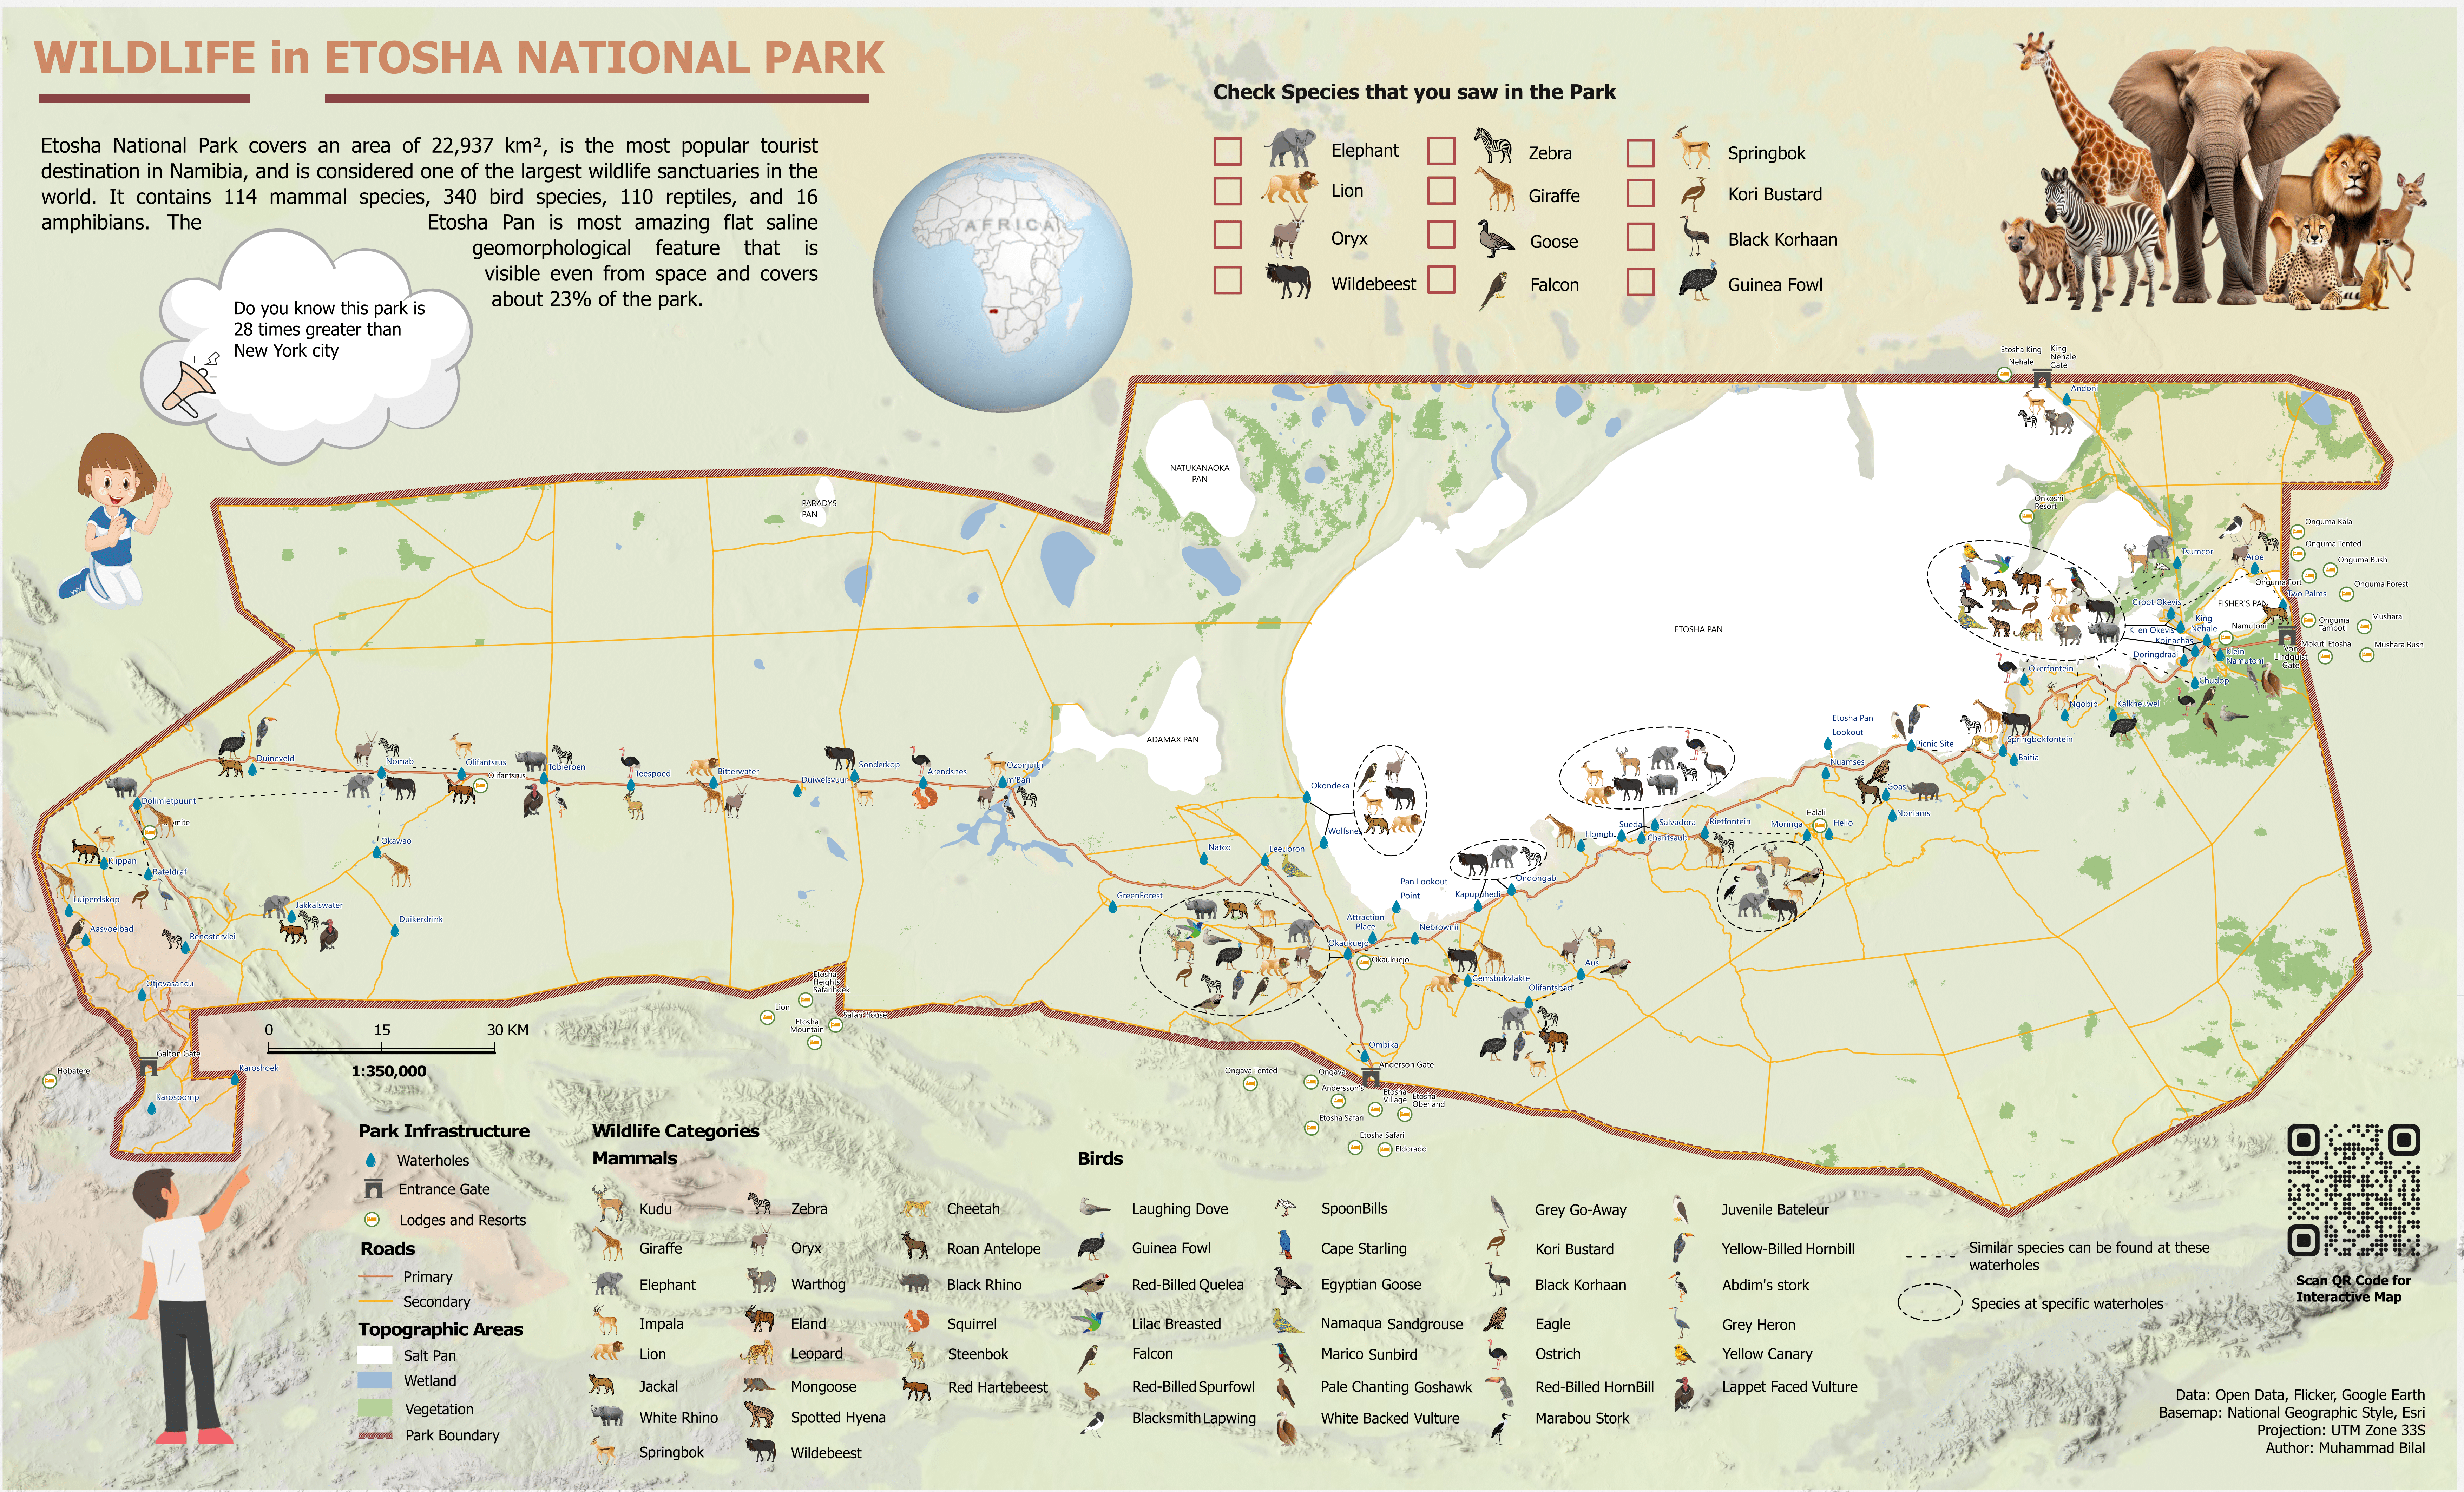
Cartographically Designed Map For the Younger People
This map is designed for younger people who like animated icons and graphics.Each species of wildlife is represented by intuitive graphic icons, along with a Kahoot game for kids as well. The Kahoot game basically asks the younger users questions that mark the species that they have seen in the park. The decision to use graphic symbols of wildlife in the maps was to take advantage of people's cognitive abilities for recognition, which means young people would easily interpret graphical icons. The QR code in the map allow user to access web map.

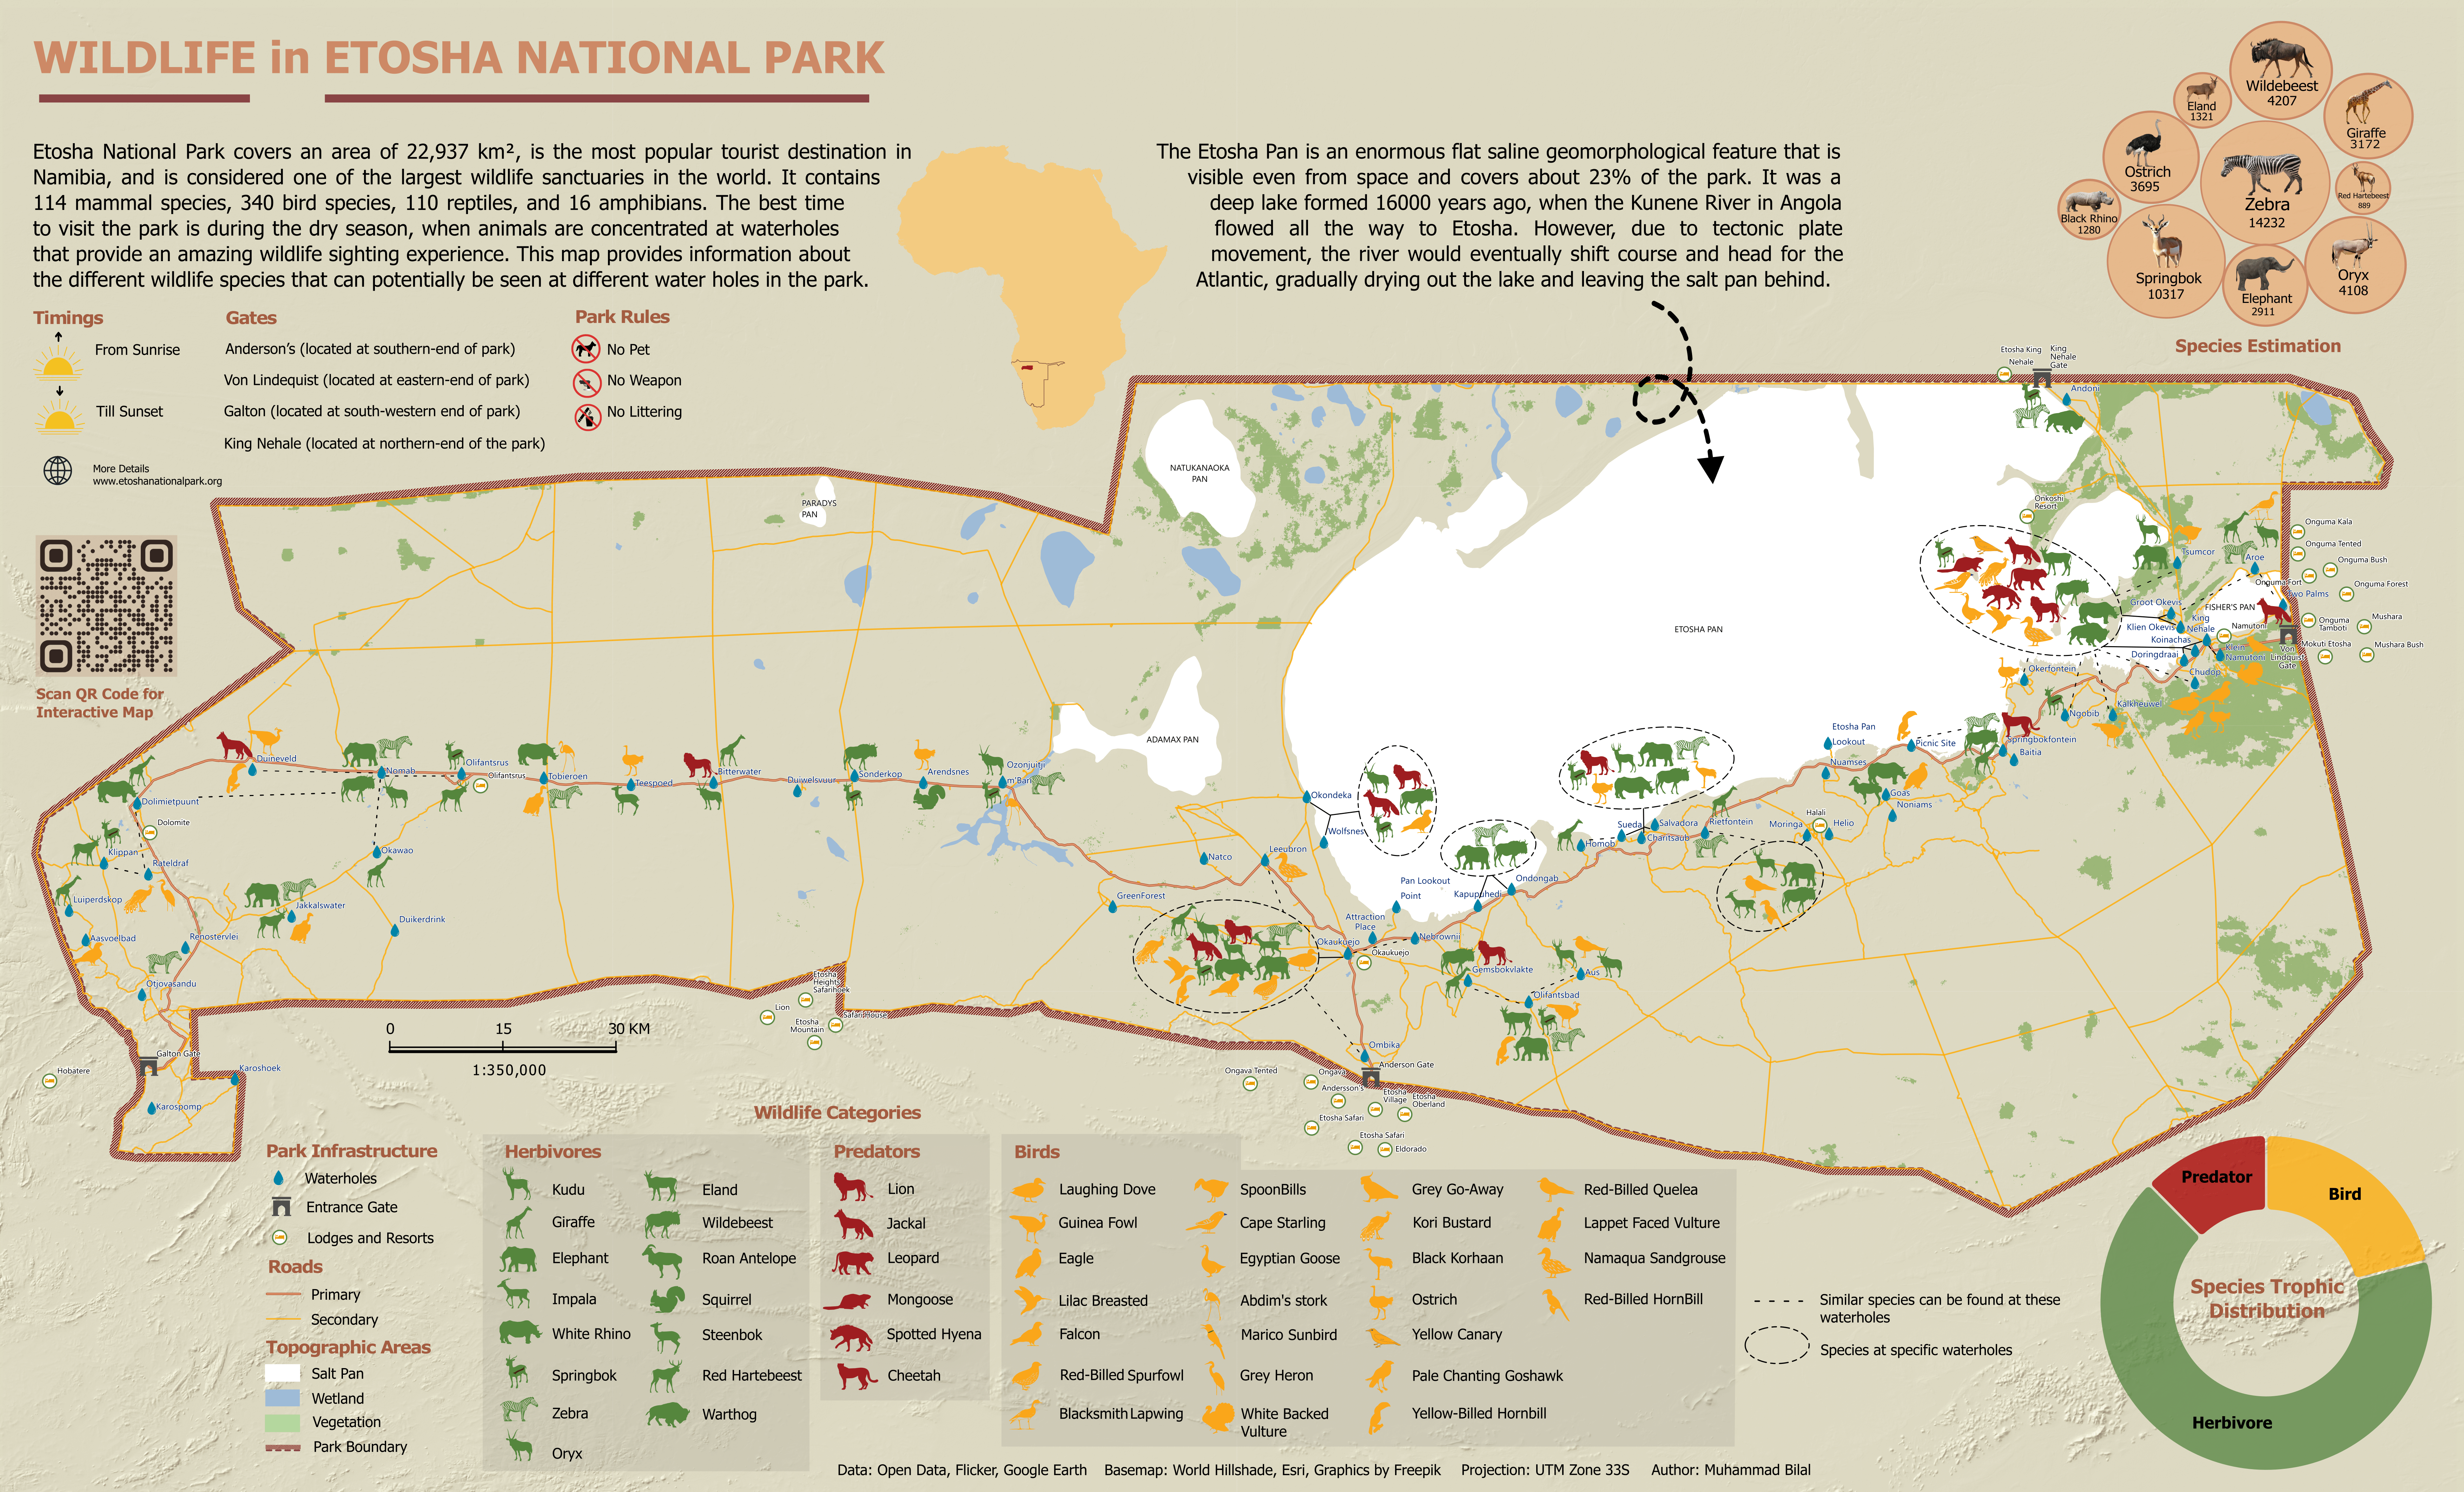
Cartographically Designed Map For the General Public
This type of map is designed for the public who are planning to visit this park. It has intuitive icons representing wildlife and also park general information. The decision to use graphic symbols of wildlife in the maps was to take advantage of people's cognitive abilities for recognition, which means young people would easily interpret graphical icons. This map also visualizes statistical information related to species estimation using attractive infographics and trophic level distribution information using a pie chart. The QR code in the map allow user to access web map. The QR code in the map allow user to access web map.

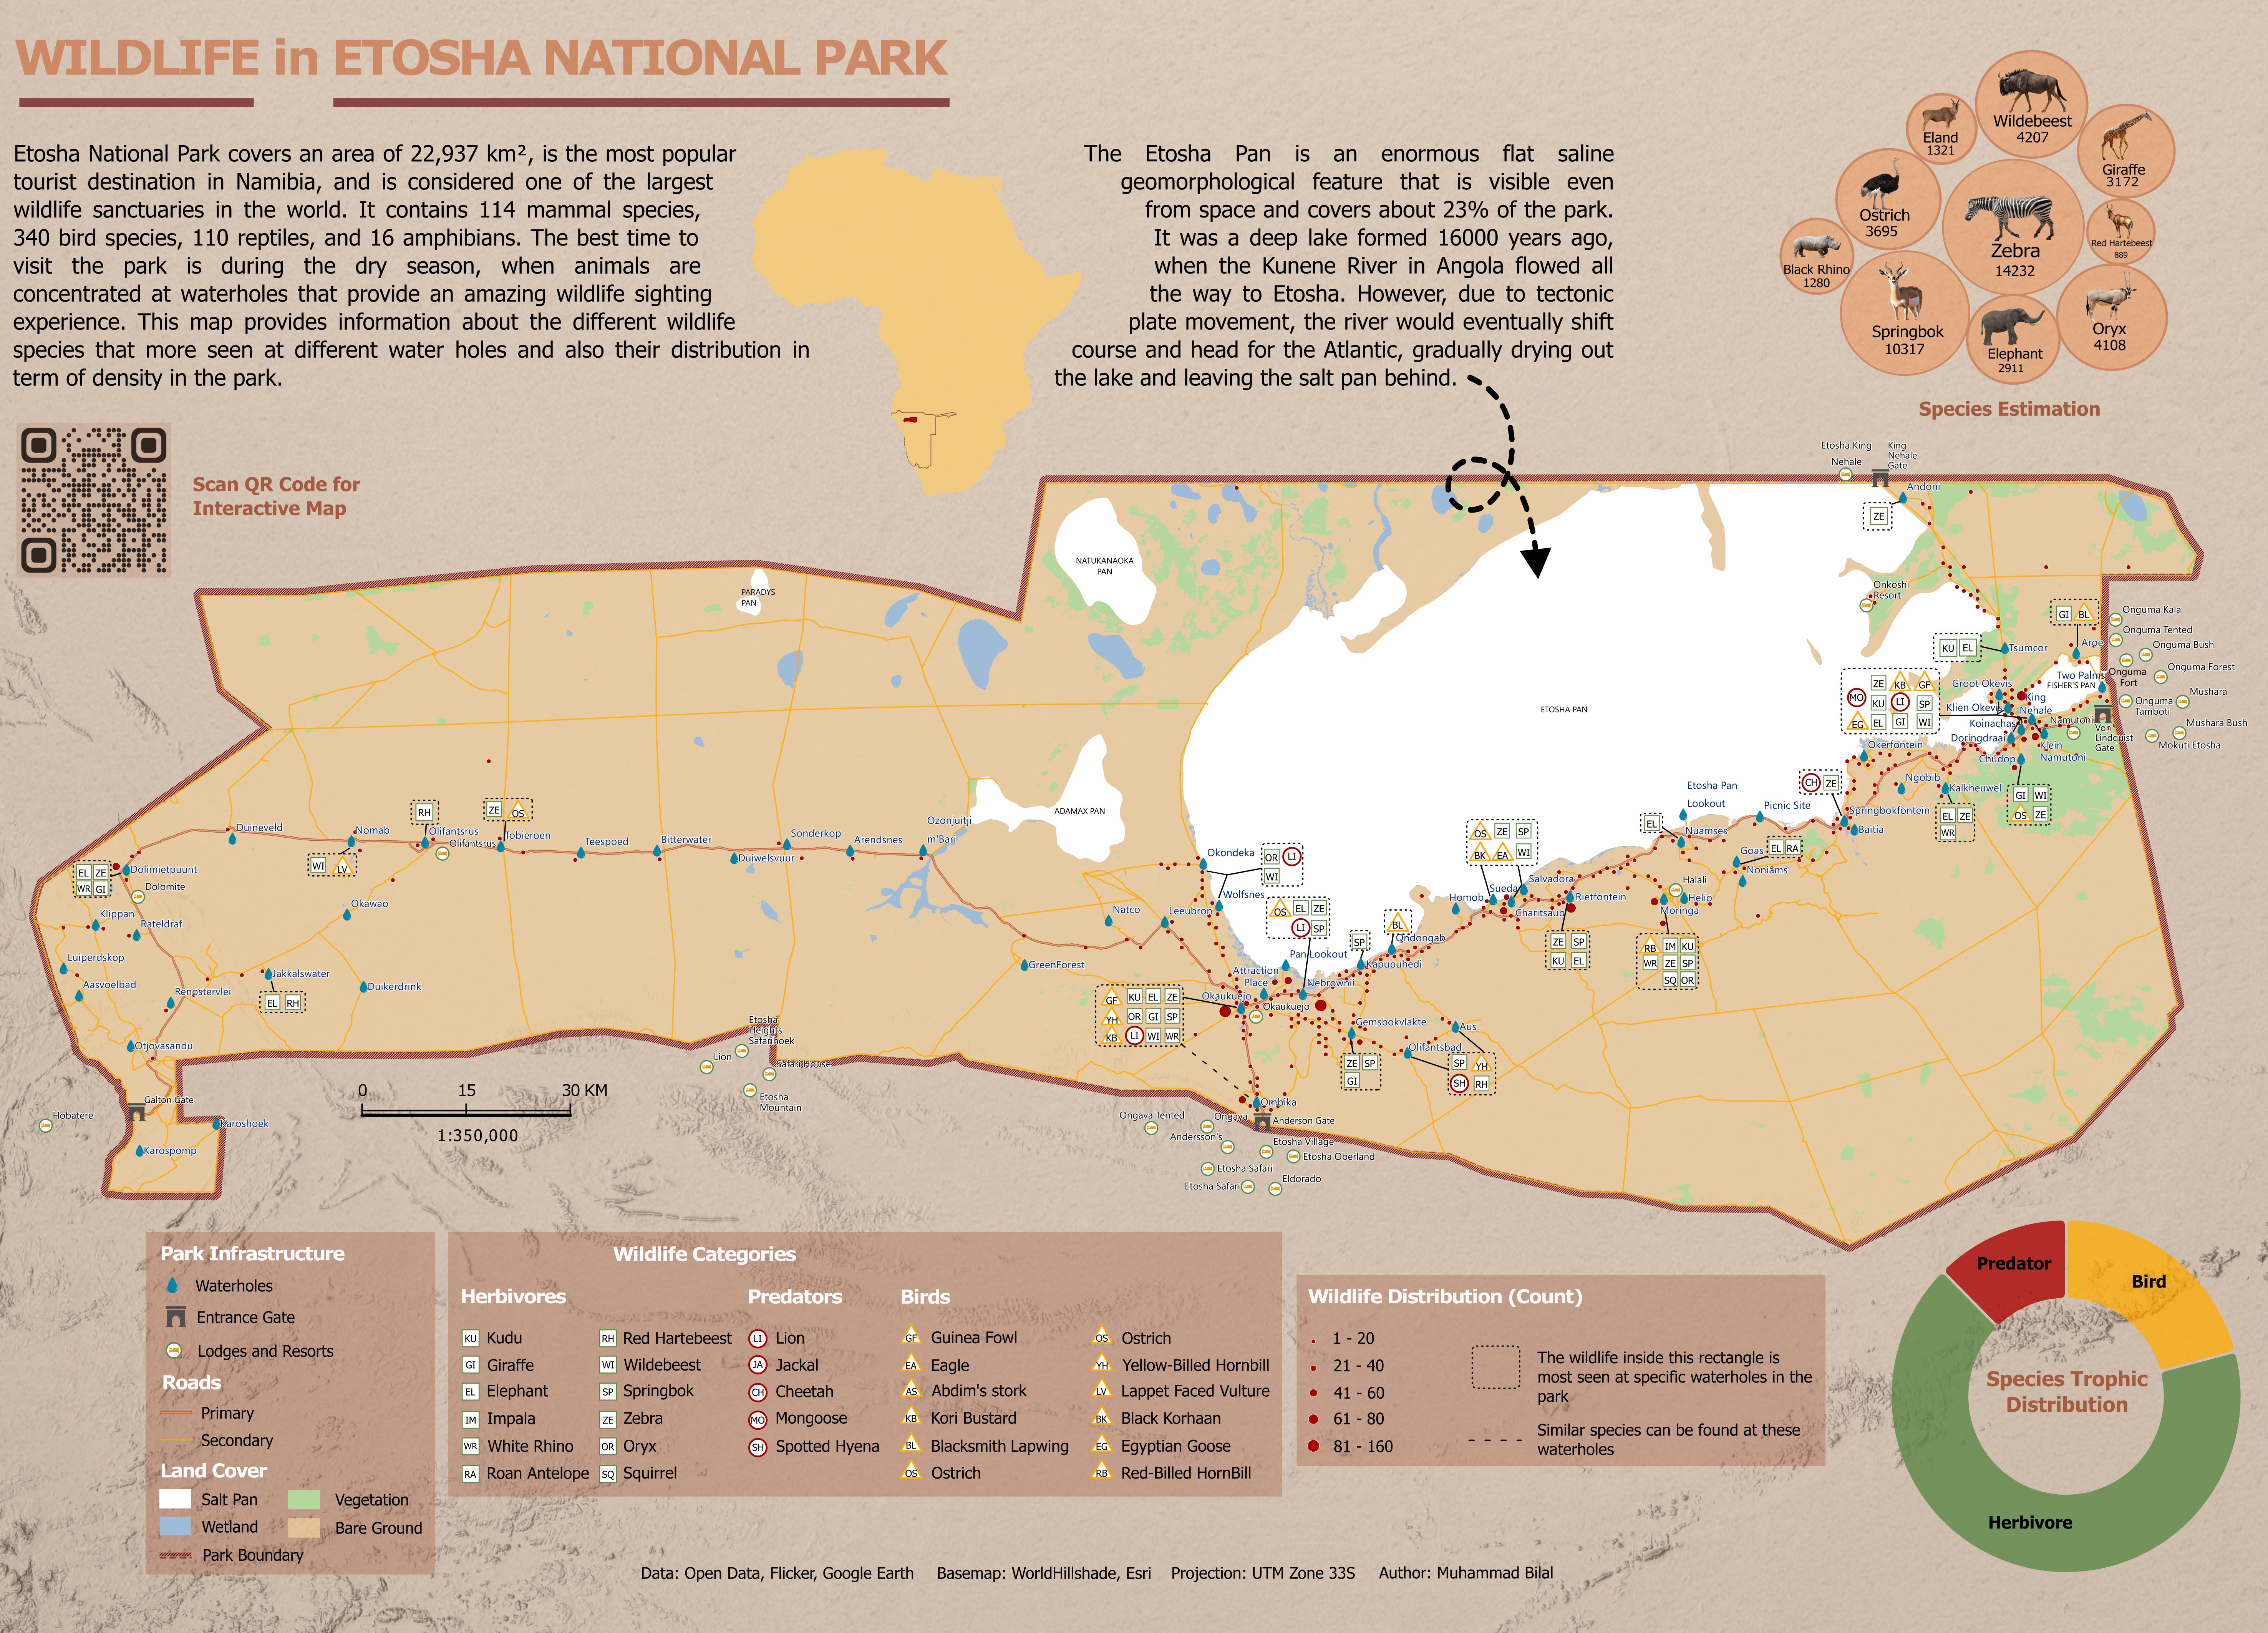
Cartographically Designed Map For the Expert Peoplec
This type of map is designed for those who have a basic understanding of reading maps. The geometrical symbols for the expert group map were used to represent wildlife species in Etosha National Park because of the cartographic background knowledge of the users. This map also visualizes statistical information related to species estimation using attractive infographics and trophic level distribution information using a pie chart. The QR code on the map allows users toto access a web map.

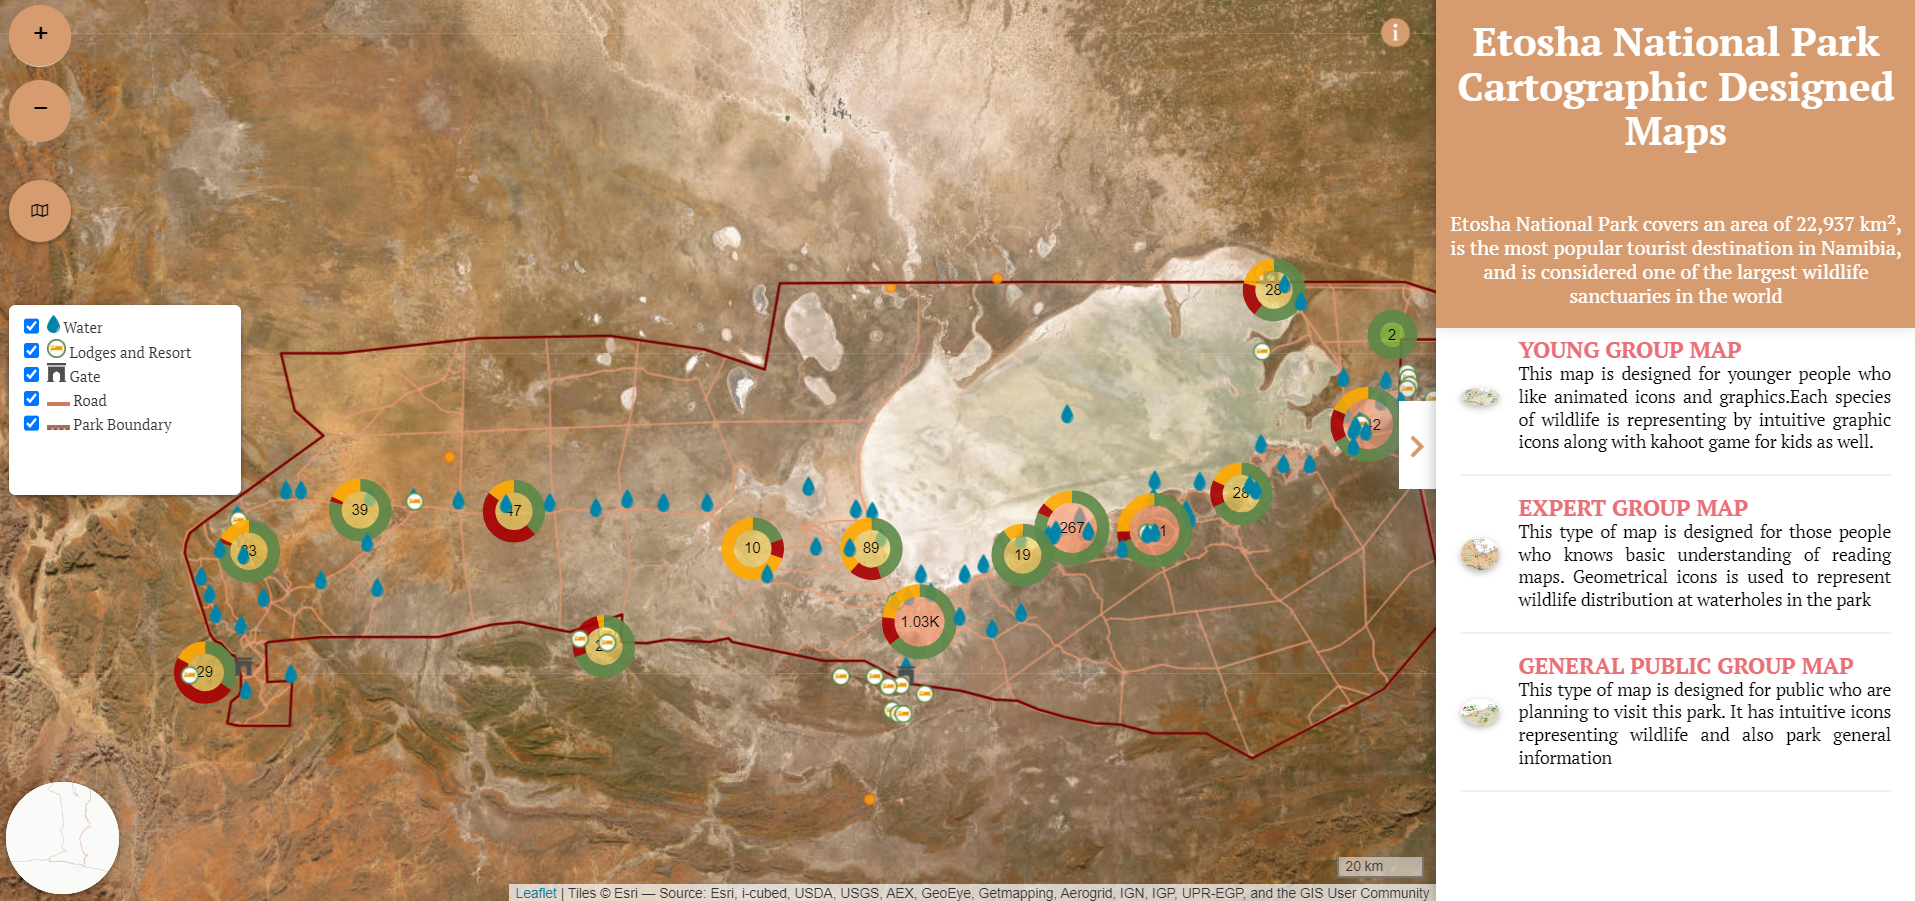
Web Map of Etosha National Park
The purpose of an interactive web map was to allow users to dynamically interact with wildlife species data and landscape features of the park in a user-friendly way and to view, as well as download, cartographically designed different user group maps from the web map. The multiple basemaps, zooming, and popup with image functionality were implemented to attract users. The donut cluster functionality was also implemented so that users could see the trophic distribution of wildlife in the park.
